Published March 13, 2017
| Version 1.0
Dataset
Open
Identifying and Quantifying Mineral Abundance through VSWIR Microimaging Spectroscopy: A Comparison to XRD and SEM
Creators

Description
Visible-shortwave infrared microimaging reflectance spectroscopy is a new technique to identify minerals, quantify abundances, and assess textural relationships at sub-millimetre scale without destructive sample preparation. Here we used a prototype instrument to image serpentinized igneous rocks and carbonate-rich travertine deposits to evaluate performance, relative to traditional techniques: XRD (mineralogical analysis of bulk powders with no texture preservation) and SEM/EDS (analysis of phases and textures using chemical data from polished thin sections). VSWIR microimaging spectroscopy is ideal for identifying spatially coherent rare phases, below XRD detection limits. The progress of alteration can also be inferred from spectral parameters and may correspond to phases that are amorphous in XRD. However, VSWIR microimaging spectroscopy can sometimes be challenging with analyses of very dark materials (reflectance <0.05) and mineral mixtures occurring at a spatial scales multiple factors below the pixel size. Abundances derived from linear unmixing typically agree with those from XRD and EDS within ~10%.
Other
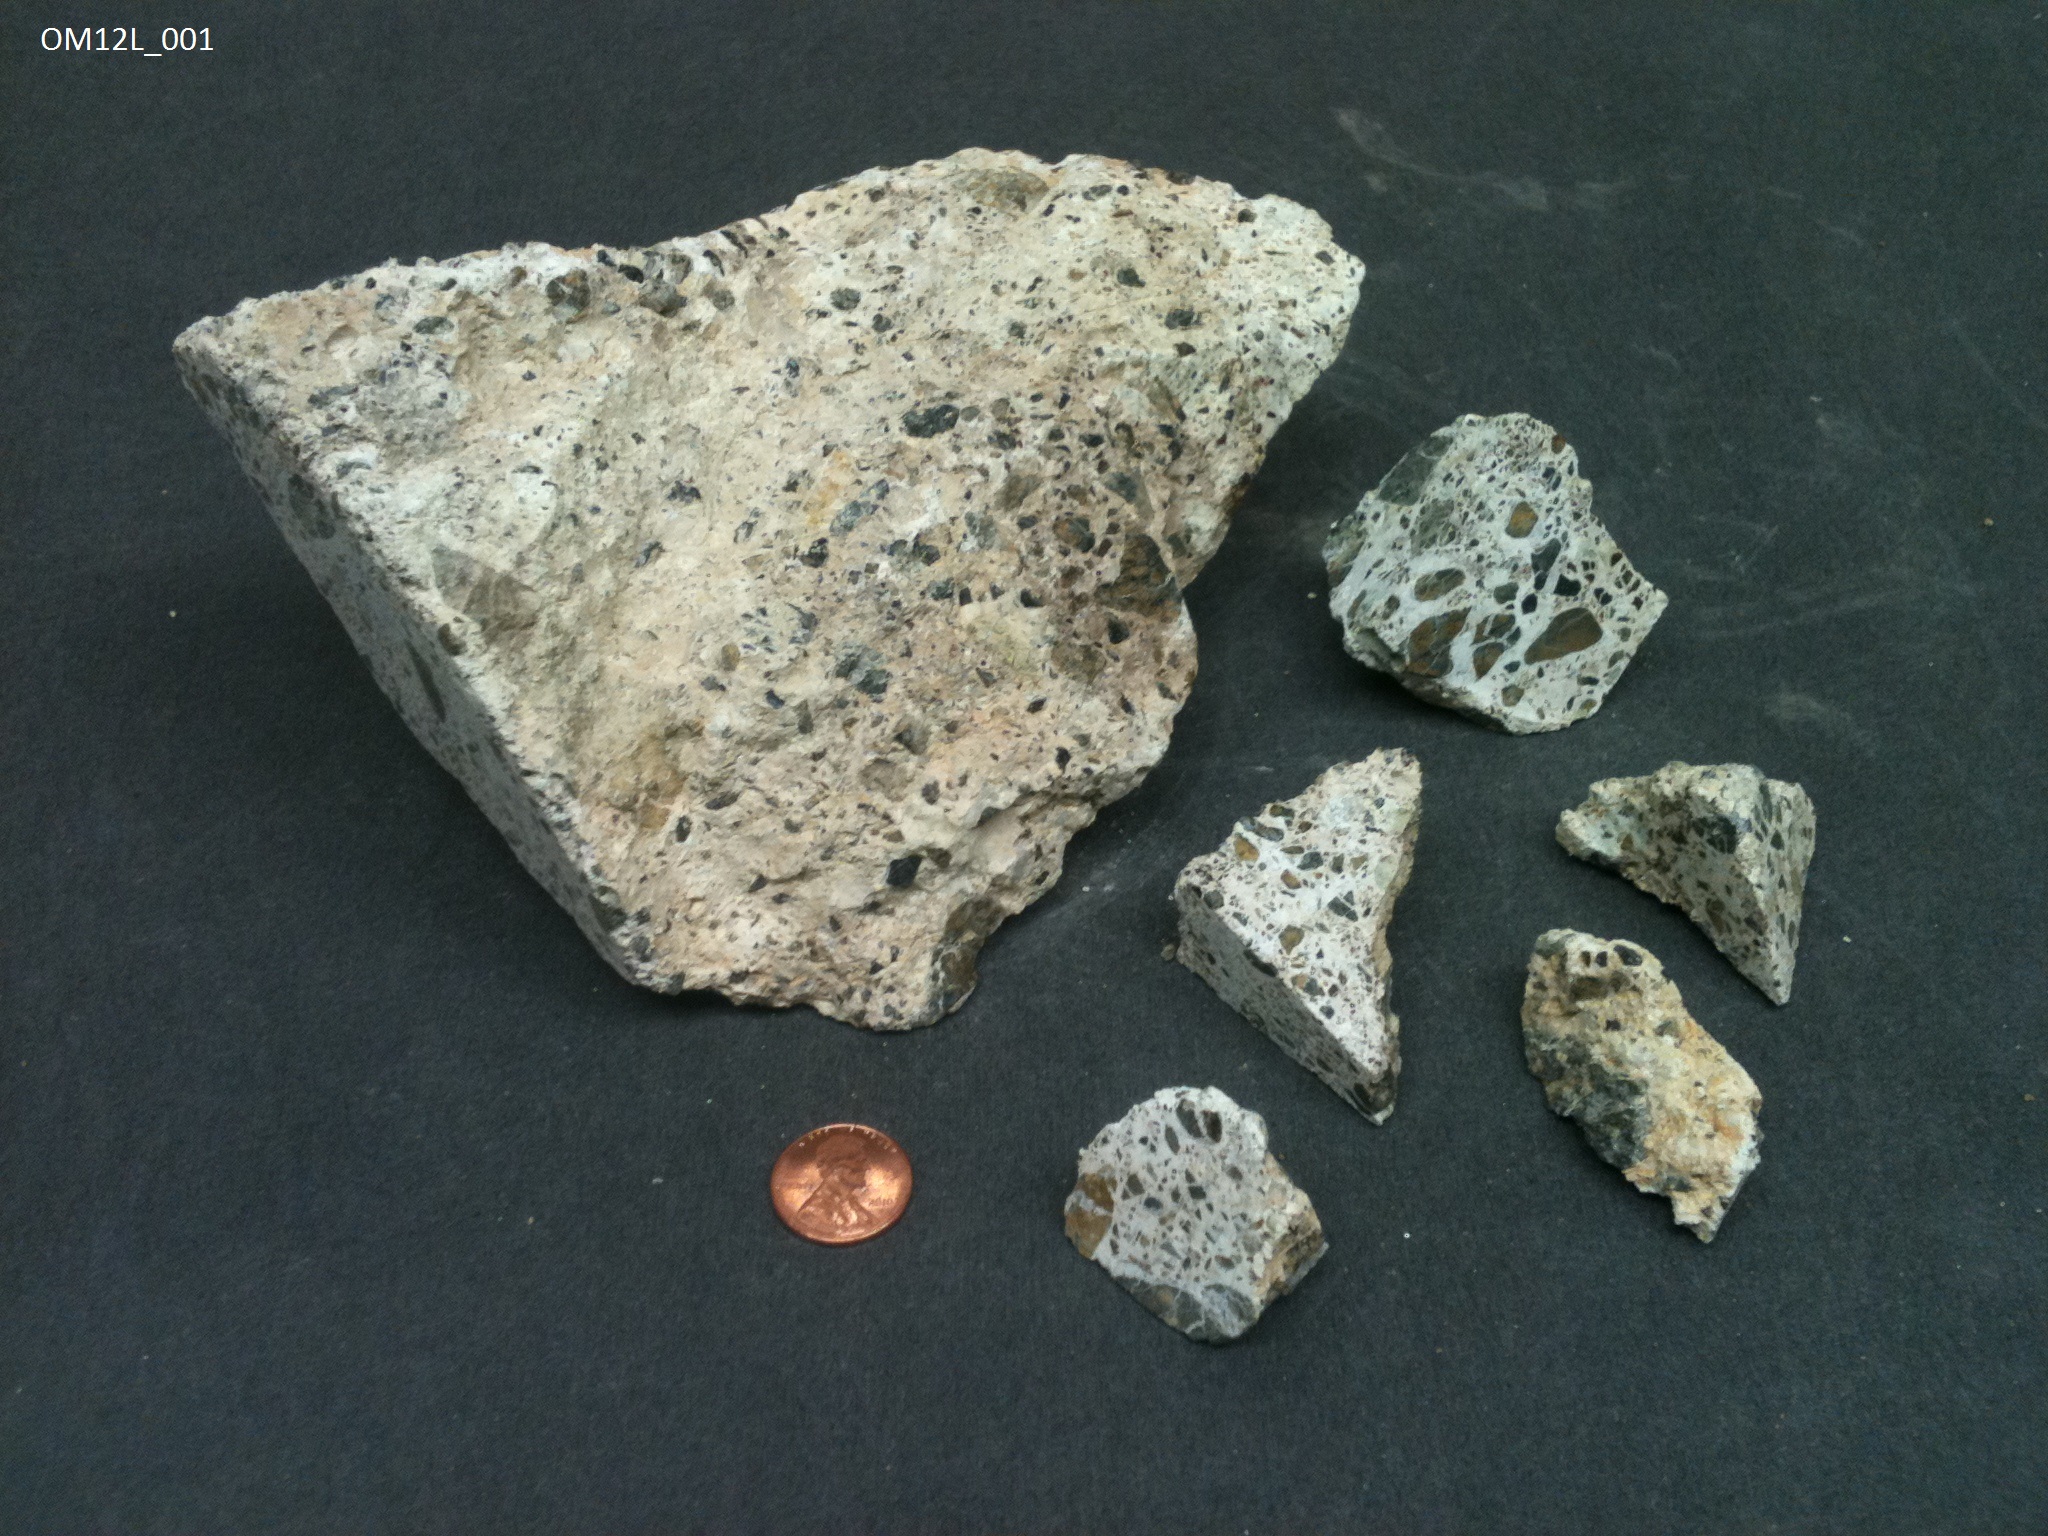
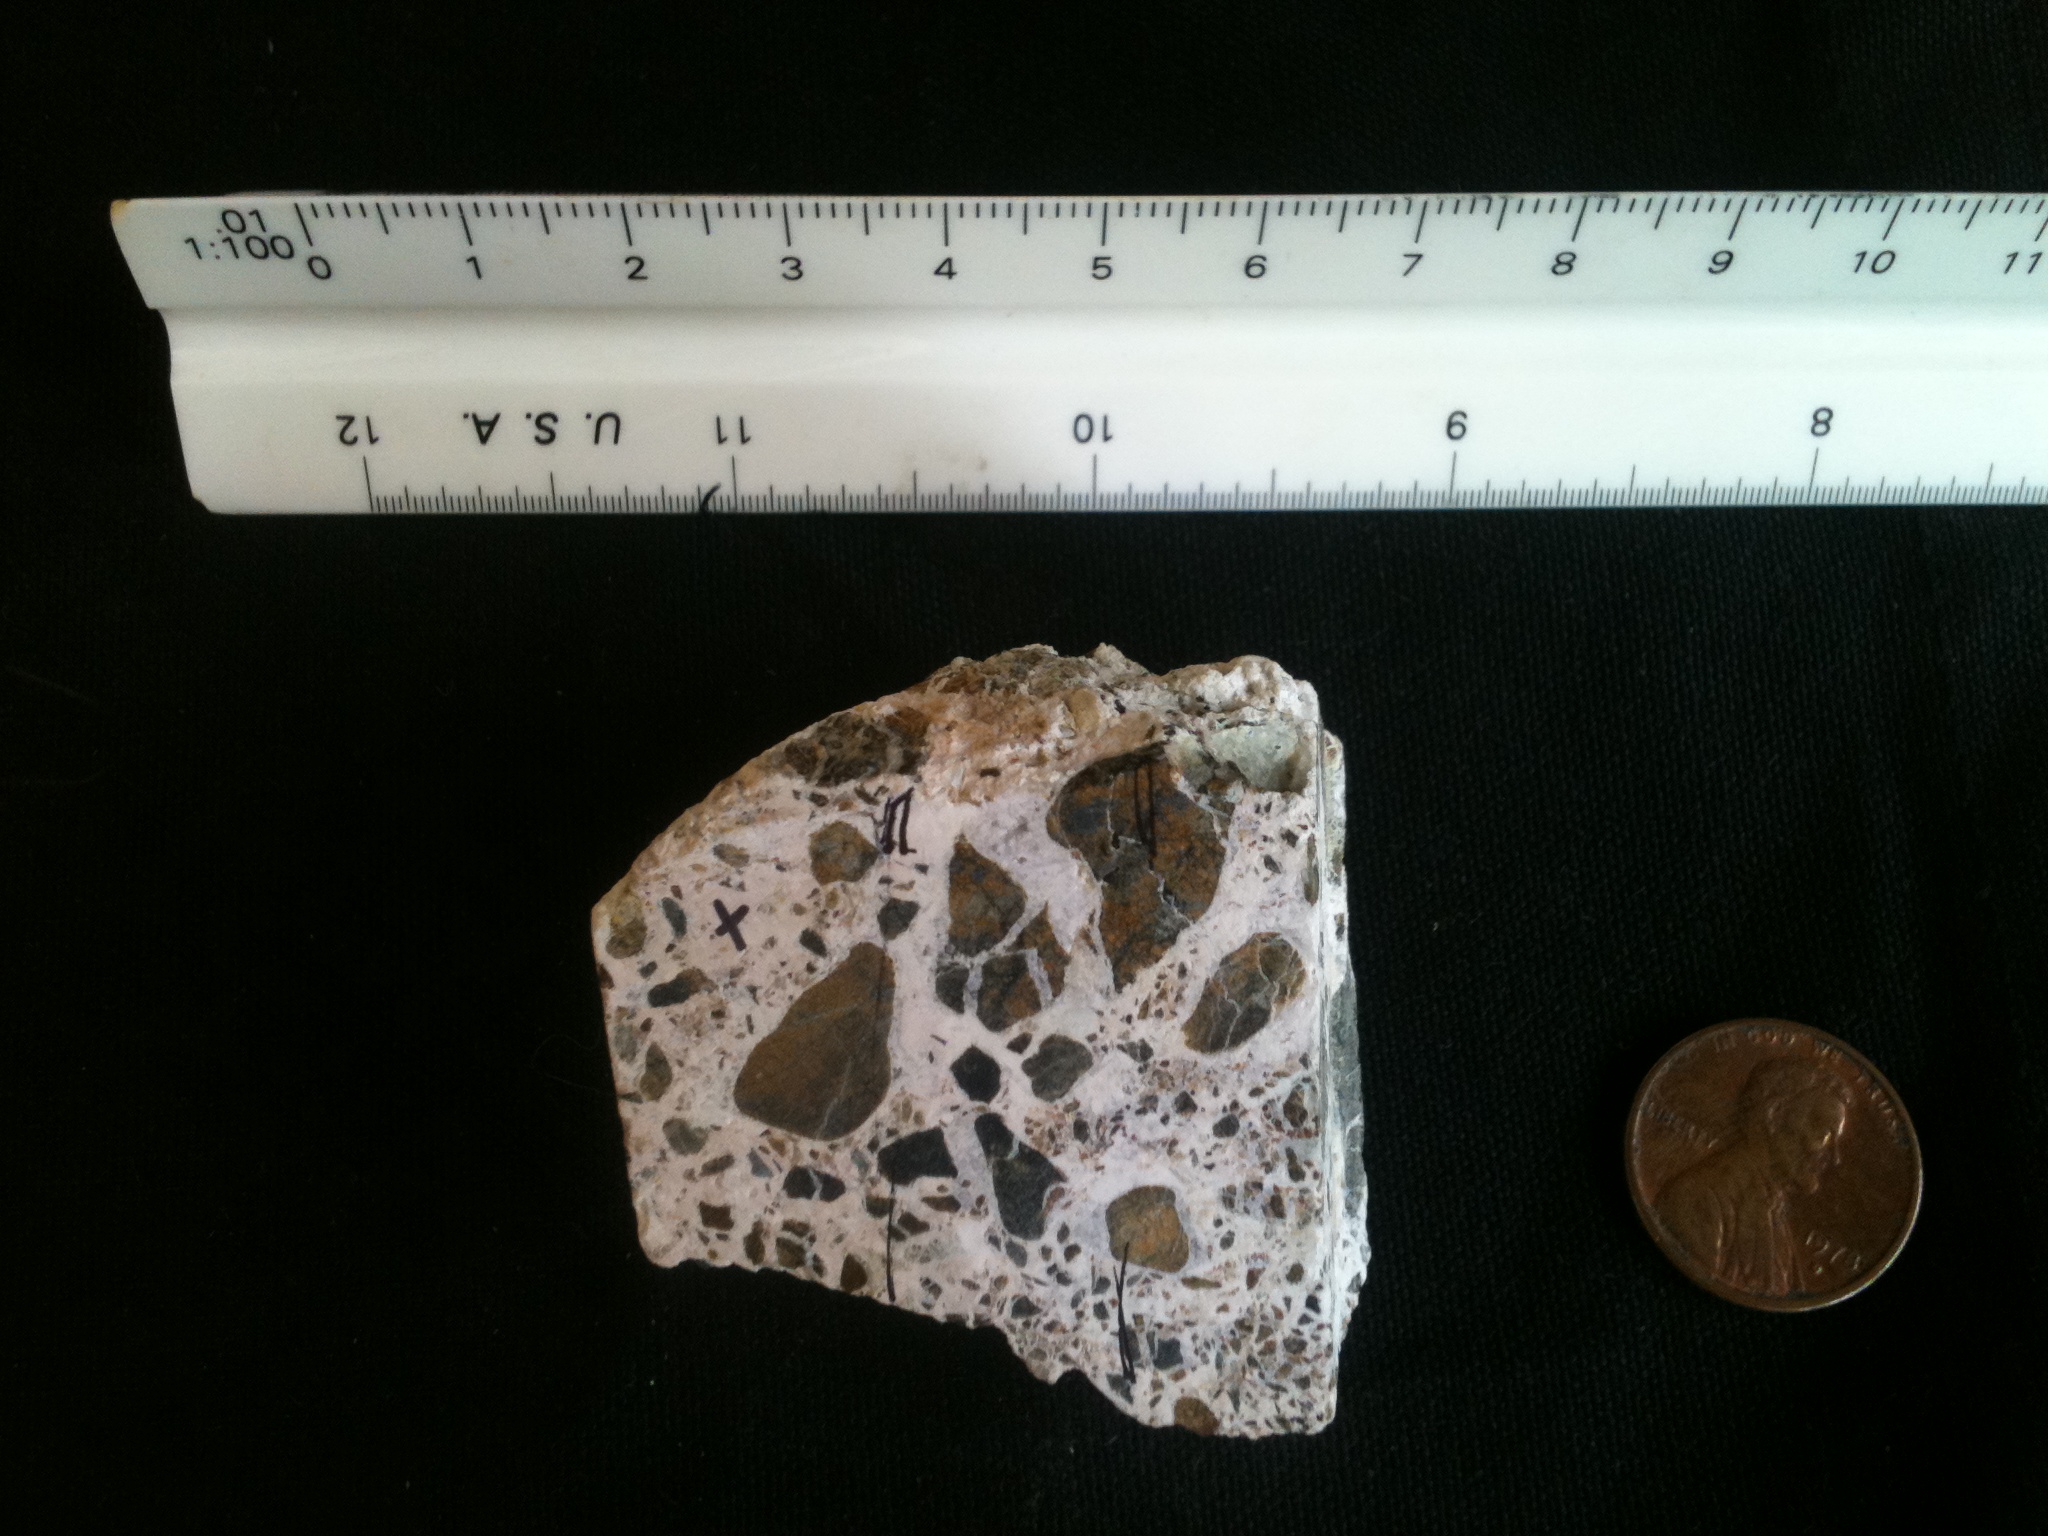
Sample: A rock was collected from an travertine conglomerate, containing ophiolite clasts. The rock was collected in Oman near the Samail ophiolite (collected Jan 2012; B. Ehlmann; analyzed in Leask & Ehlmann, 2016). Data included are: 1) UCIS (Ultra-Compact Imaging Spectrometer; B. Van Gorp et al) data cube. Data near ends of sensor may be suspect [e.g. under 500 nm, over 2500 nm]. {OM12L_001_UCIS_cube_masked} 2) EDS-SEM mosaic image cube (4x downsampled to despeckle, using a nearest neighbour algorithm). Acquired Caltech October 2015. Chemical data are in atomic %. {om12L_001_SEM_4x_masked} 3) EDS-SEM data warped to UCIS cube [degree 4 convolution, using built-in ENVI warping algorithm and hand-picked ground-control points]. Three UCIS images were mosaicked together to build the base image. Note whole image difficult to match 100% perfectly; easier to line up a smaller subset. {OM12L_001_warp_SEM_to_UCIS} 4) XRD data (quantitative analysis done Aug 2015 by Actlabs). Note that the subsamples of the rock crushed for XRD analysis are not the same subsample imaged, although all come from the same rock. 5) Photographs of rock sample for context (taken by C.Sanders, 2014). {Macro_OM12L_001.JPG; OM12L_001_smoothface_2.jpg}Other
Related Publication: Identifying and Quantifying Mineral Abundance through VSWIR Microimaging Spectroscopy: A Comparison to XRD and SEM Leask, Ellen K. Division of Geological & Planetary Sciences, California Institute of Technology Ehlmann, Bethany L. Division of Geological & Planetary Sciences, California Institute of Technology 8th Workshop on Hyperspectral Image and Signal Processing: Evolution in Remote Sensing (WHISPERS 2016) 2016-08-24engFiles
Macro_OM12L_001.JPG
Files
(527.5 MB)
| Name | Size | |
|---|---|---|
|
md5:591f36e6077615b0f12241d6be3f0136
|
1.1 MB | Preview Download |
|
md5:92387accbbc368560145379d16942940
|
17.4 MB | Download |
|
md5:ead700b815596fb158777be7dd98b064
|
717 Bytes | Download |
|
md5:4277e0e67050de04972c91c1c452badb
|
898.7 kB | Preview Download |
|
md5:7014ba261ac11a37587a6c7b9df248c3
|
194.4 MB | Download |
|
md5:87ffba212d198cd5052253b80a252e2e
|
3.2 kB | Download |
|
md5:dede9111f662f1702f33f2e67ddbc246
|
313.7 MB | Download |
|
md5:9410048515de62093c167201ffd059f7
|
15.7 kB | Download |
|
md5:179fccb47ee89ec747d3eb4fac699f6a
|
191 Bytes | Preview Download |
|
md5:d58aeb0025408205cbbdc66d532f4b7c
|
2.2 kB | Preview Download |
Additional details
Identifiers
- CALTECHDATA_ID
- 222
Related works
- Is identical to
- ftp://ftp.gps.caltech.edu/pub/ehlmann/Leask_and_Ehlmann_2016_OM12001_hyperspectralcube/ (URL)
- Is supplement to
- http://resolver.caltech.edu/CaltechAUTHORS:20160902-093920758 (URL)
Funding
- NASA
- :unav NNX12AB42G
- JPL-RTD/PDF
- Rose Hills Foundation