Published October 21, 2020
| Version 1.0
Dataset
Open
PhotoSpec solar-induced fluorescence and meteorological data: Corn, Iowa, 2017

- 1. UC Davis
-
2.
 California Institute of Technology
- 3. UCLA
- 4. University of Heidelberg
Description
Eddy‐covariance (EC) data were collected at long‐term and well‐characterized USDA agricultural flux towers within C4 (corn, Zea mays L.) cropping systems in
central Iowa. Specific sites are Coles Field (42.488414°N, −93.522582°W) for the PhotoSpec comparison in 2017. These farming systems are typical for those in the Upper Midwest corn belt (more details in Dold et al., 2017, 2019). Data were excluded under unfavorable weather conditions (e.g., rainfall, low wind turbu- lence, and high humidity) (Baker & Griffis, 2005), screened for outliers (Dold et al., 2017), and gap‐filled. Turbulent CO2 fluxes were computed using the EC method (Burba, 2013), and then net ecosystem exchange was partitioned into GPP and ecosystem respiration (Re).
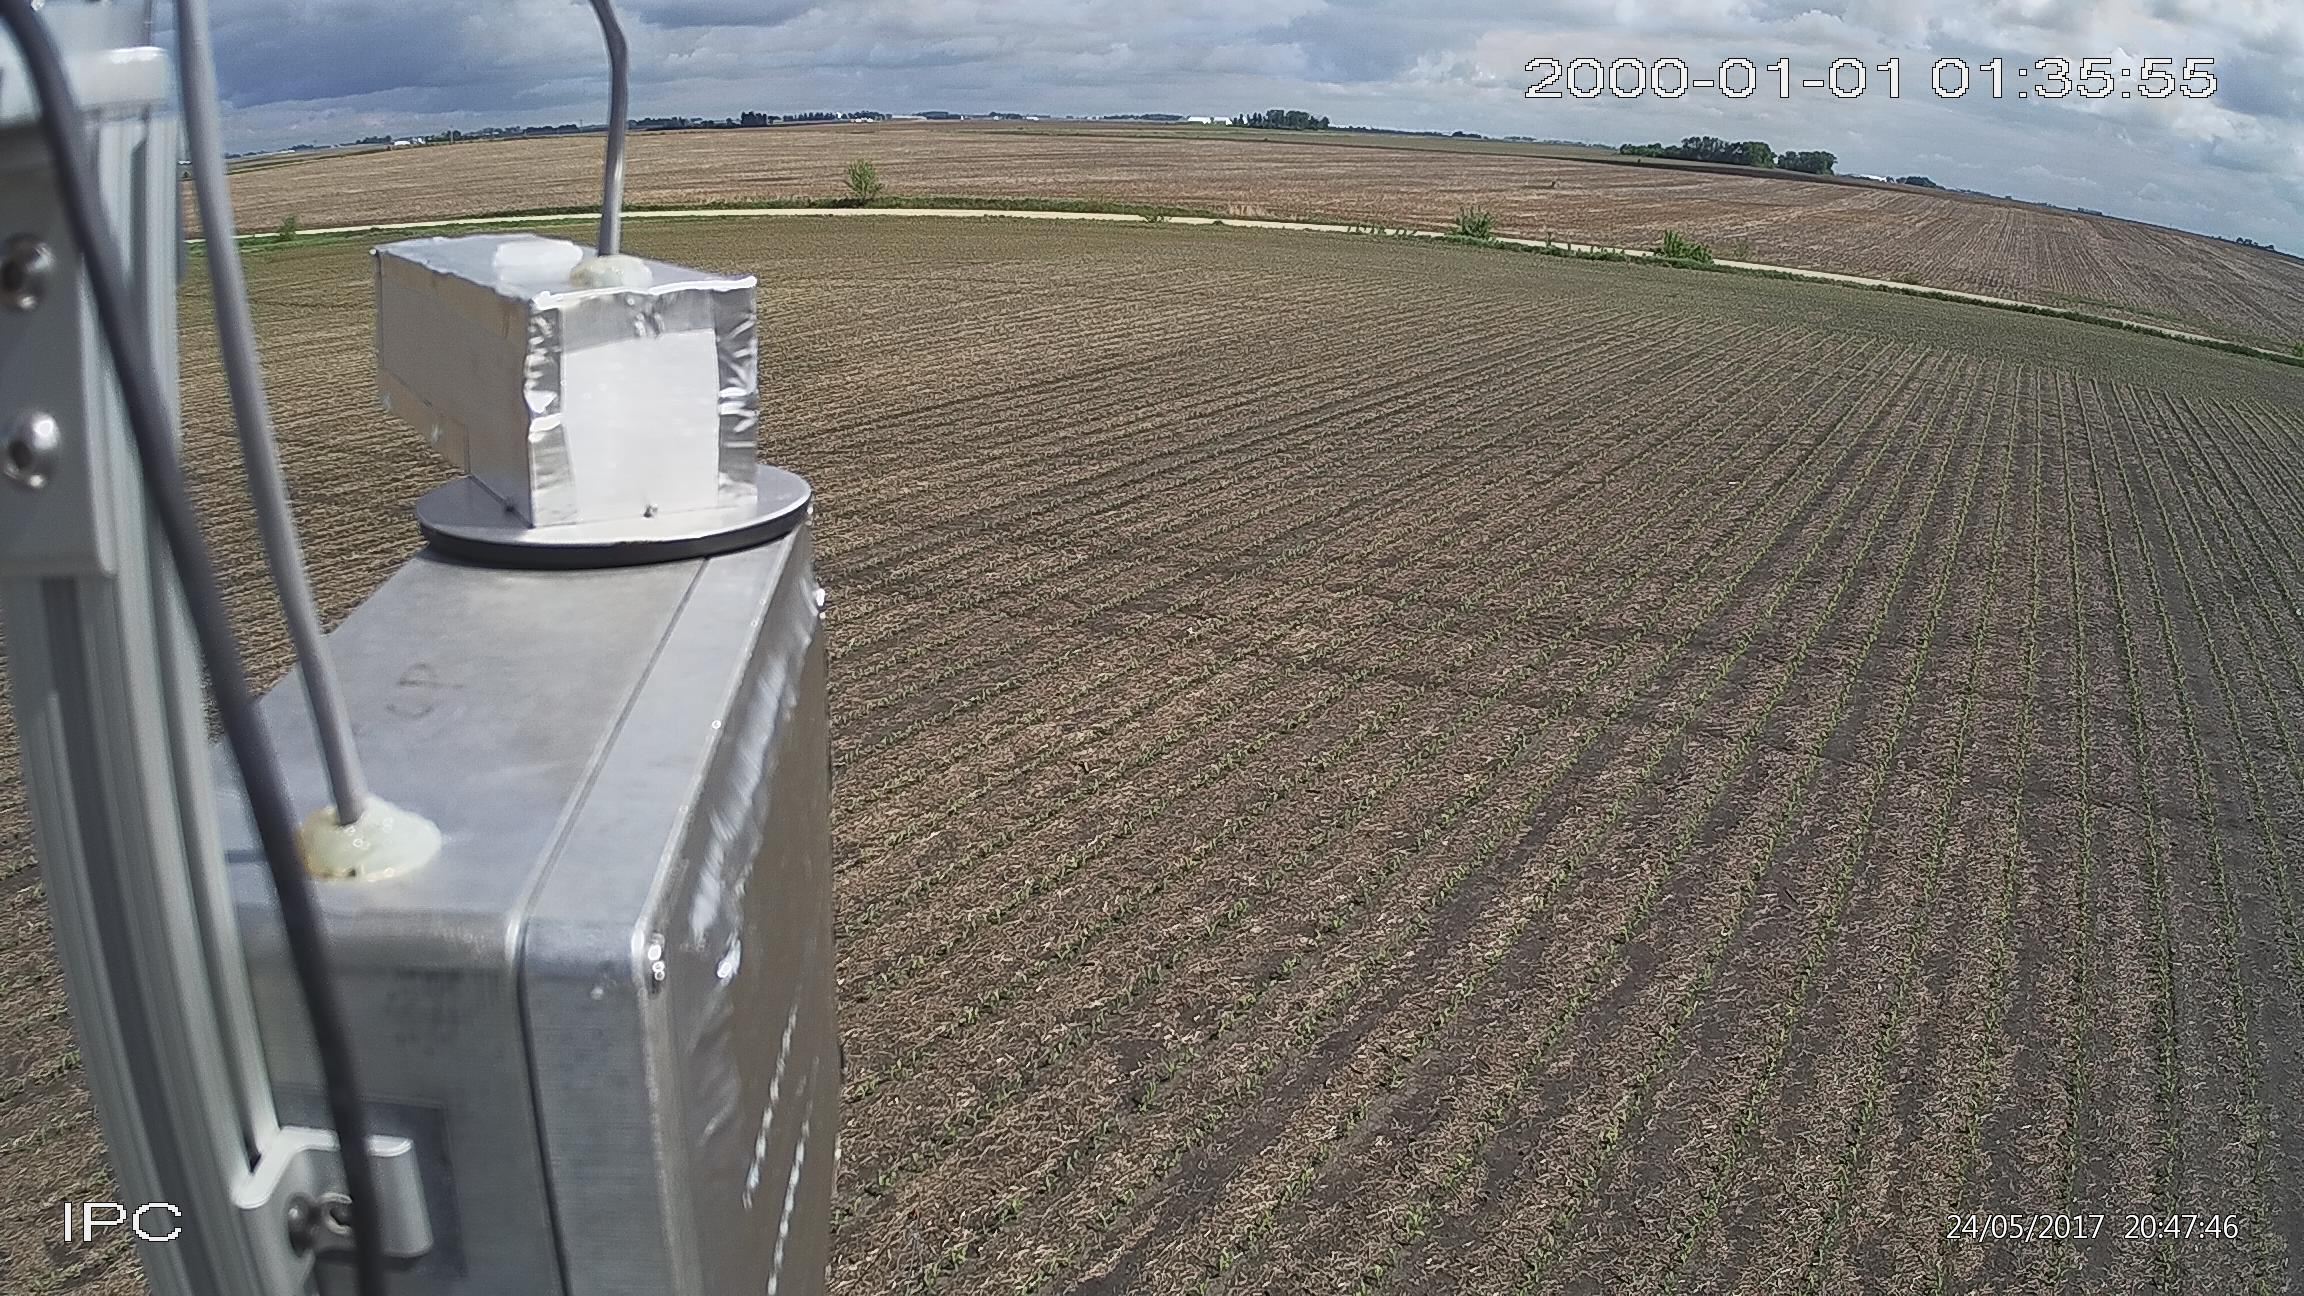
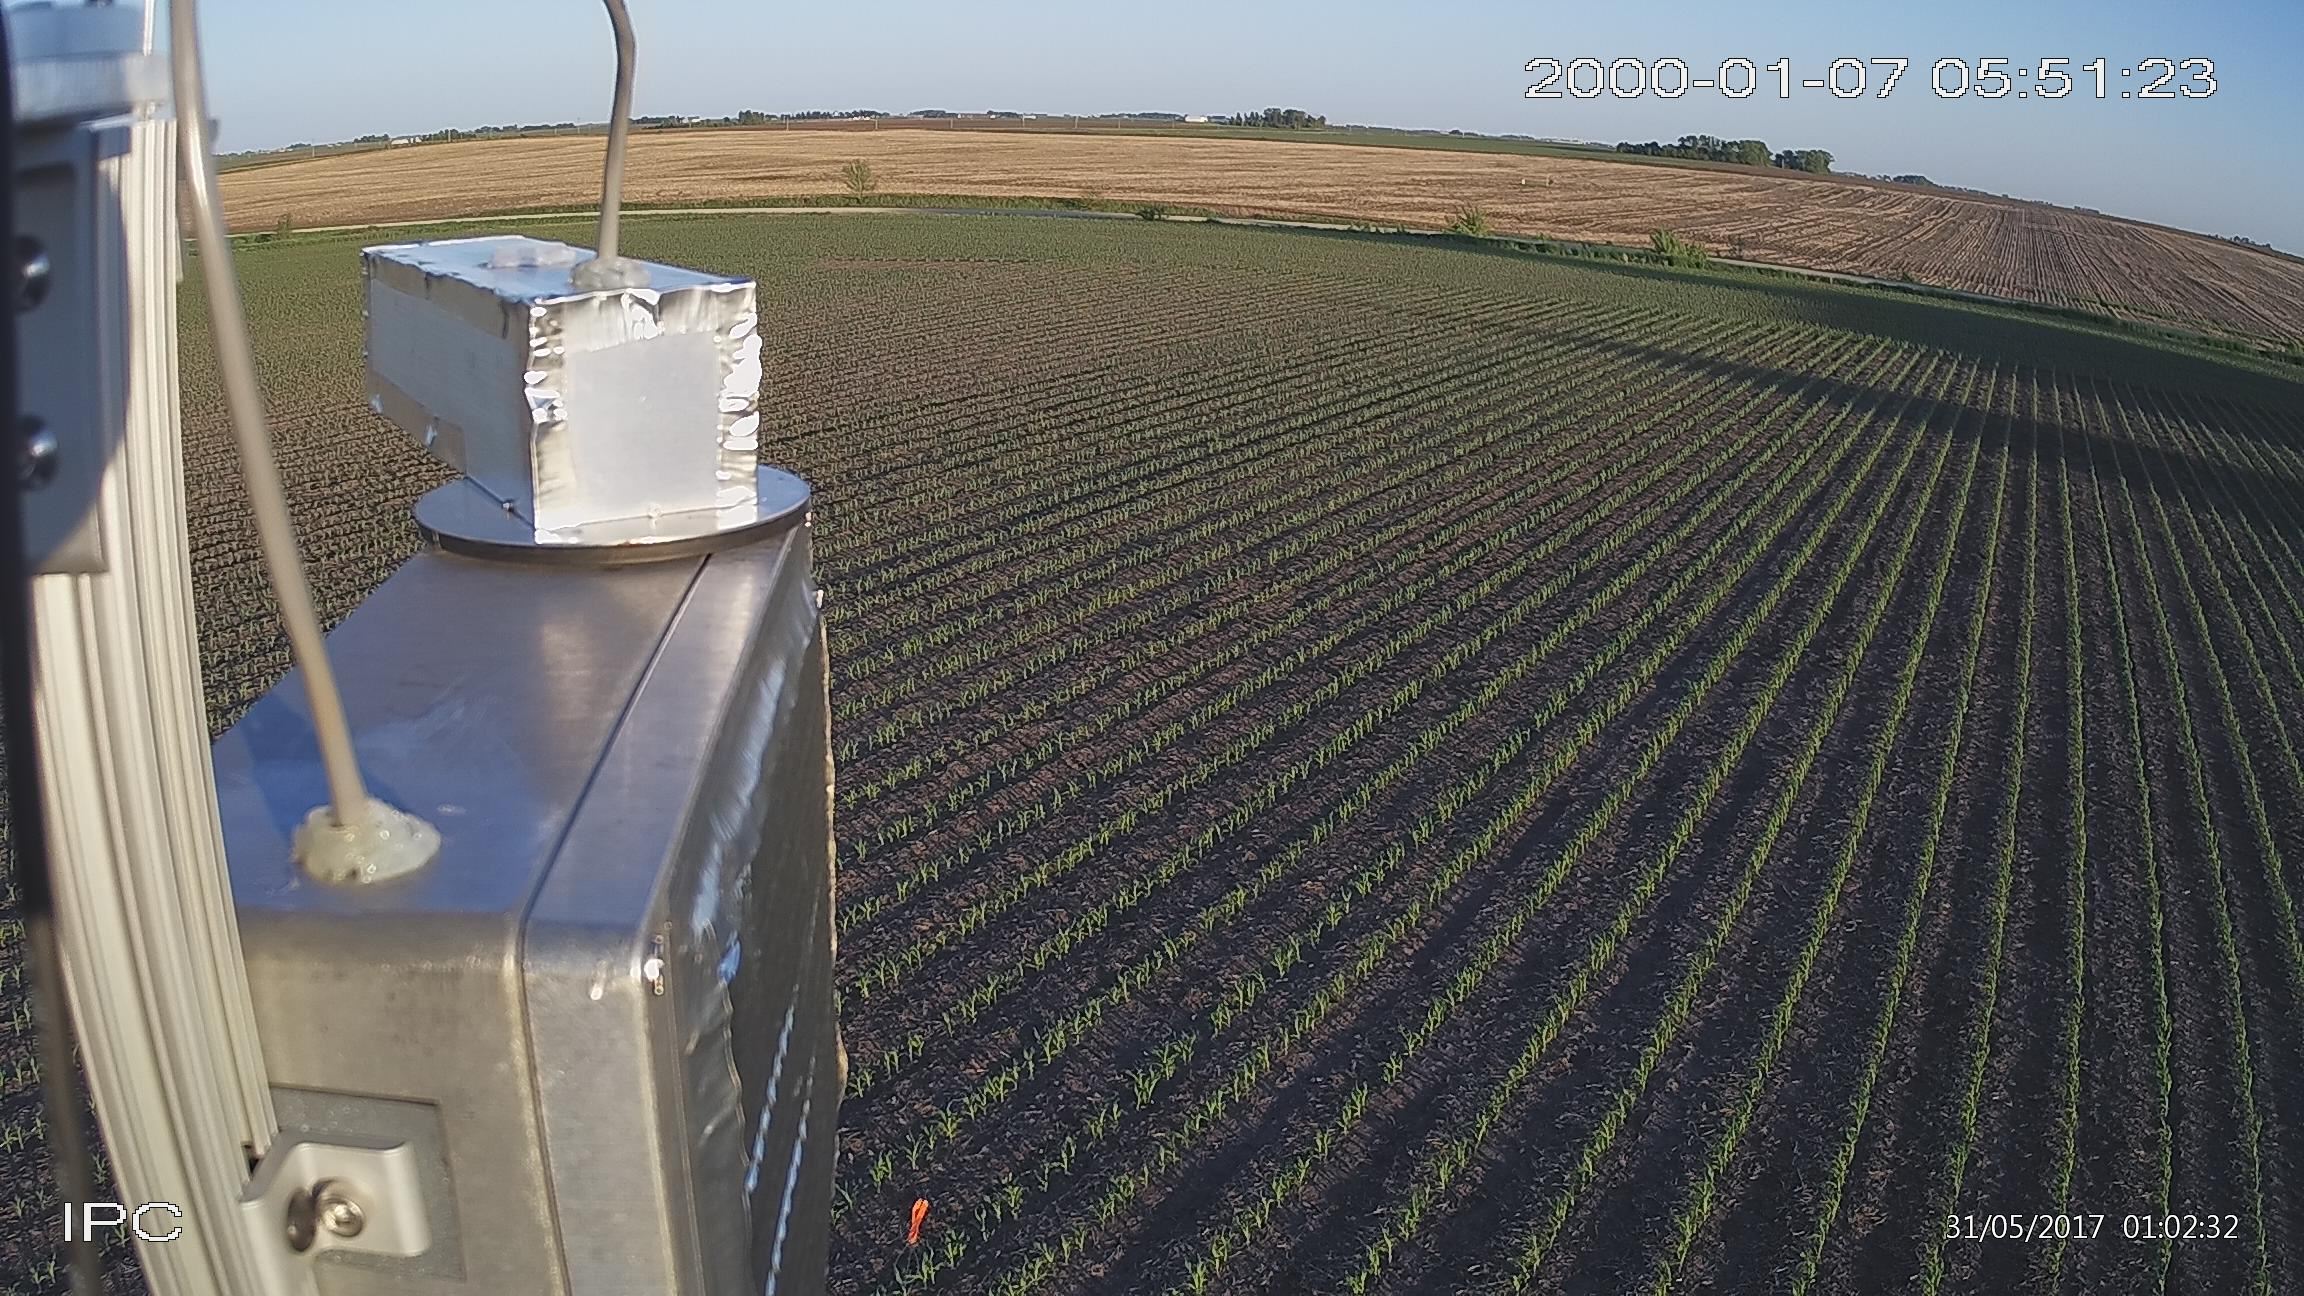
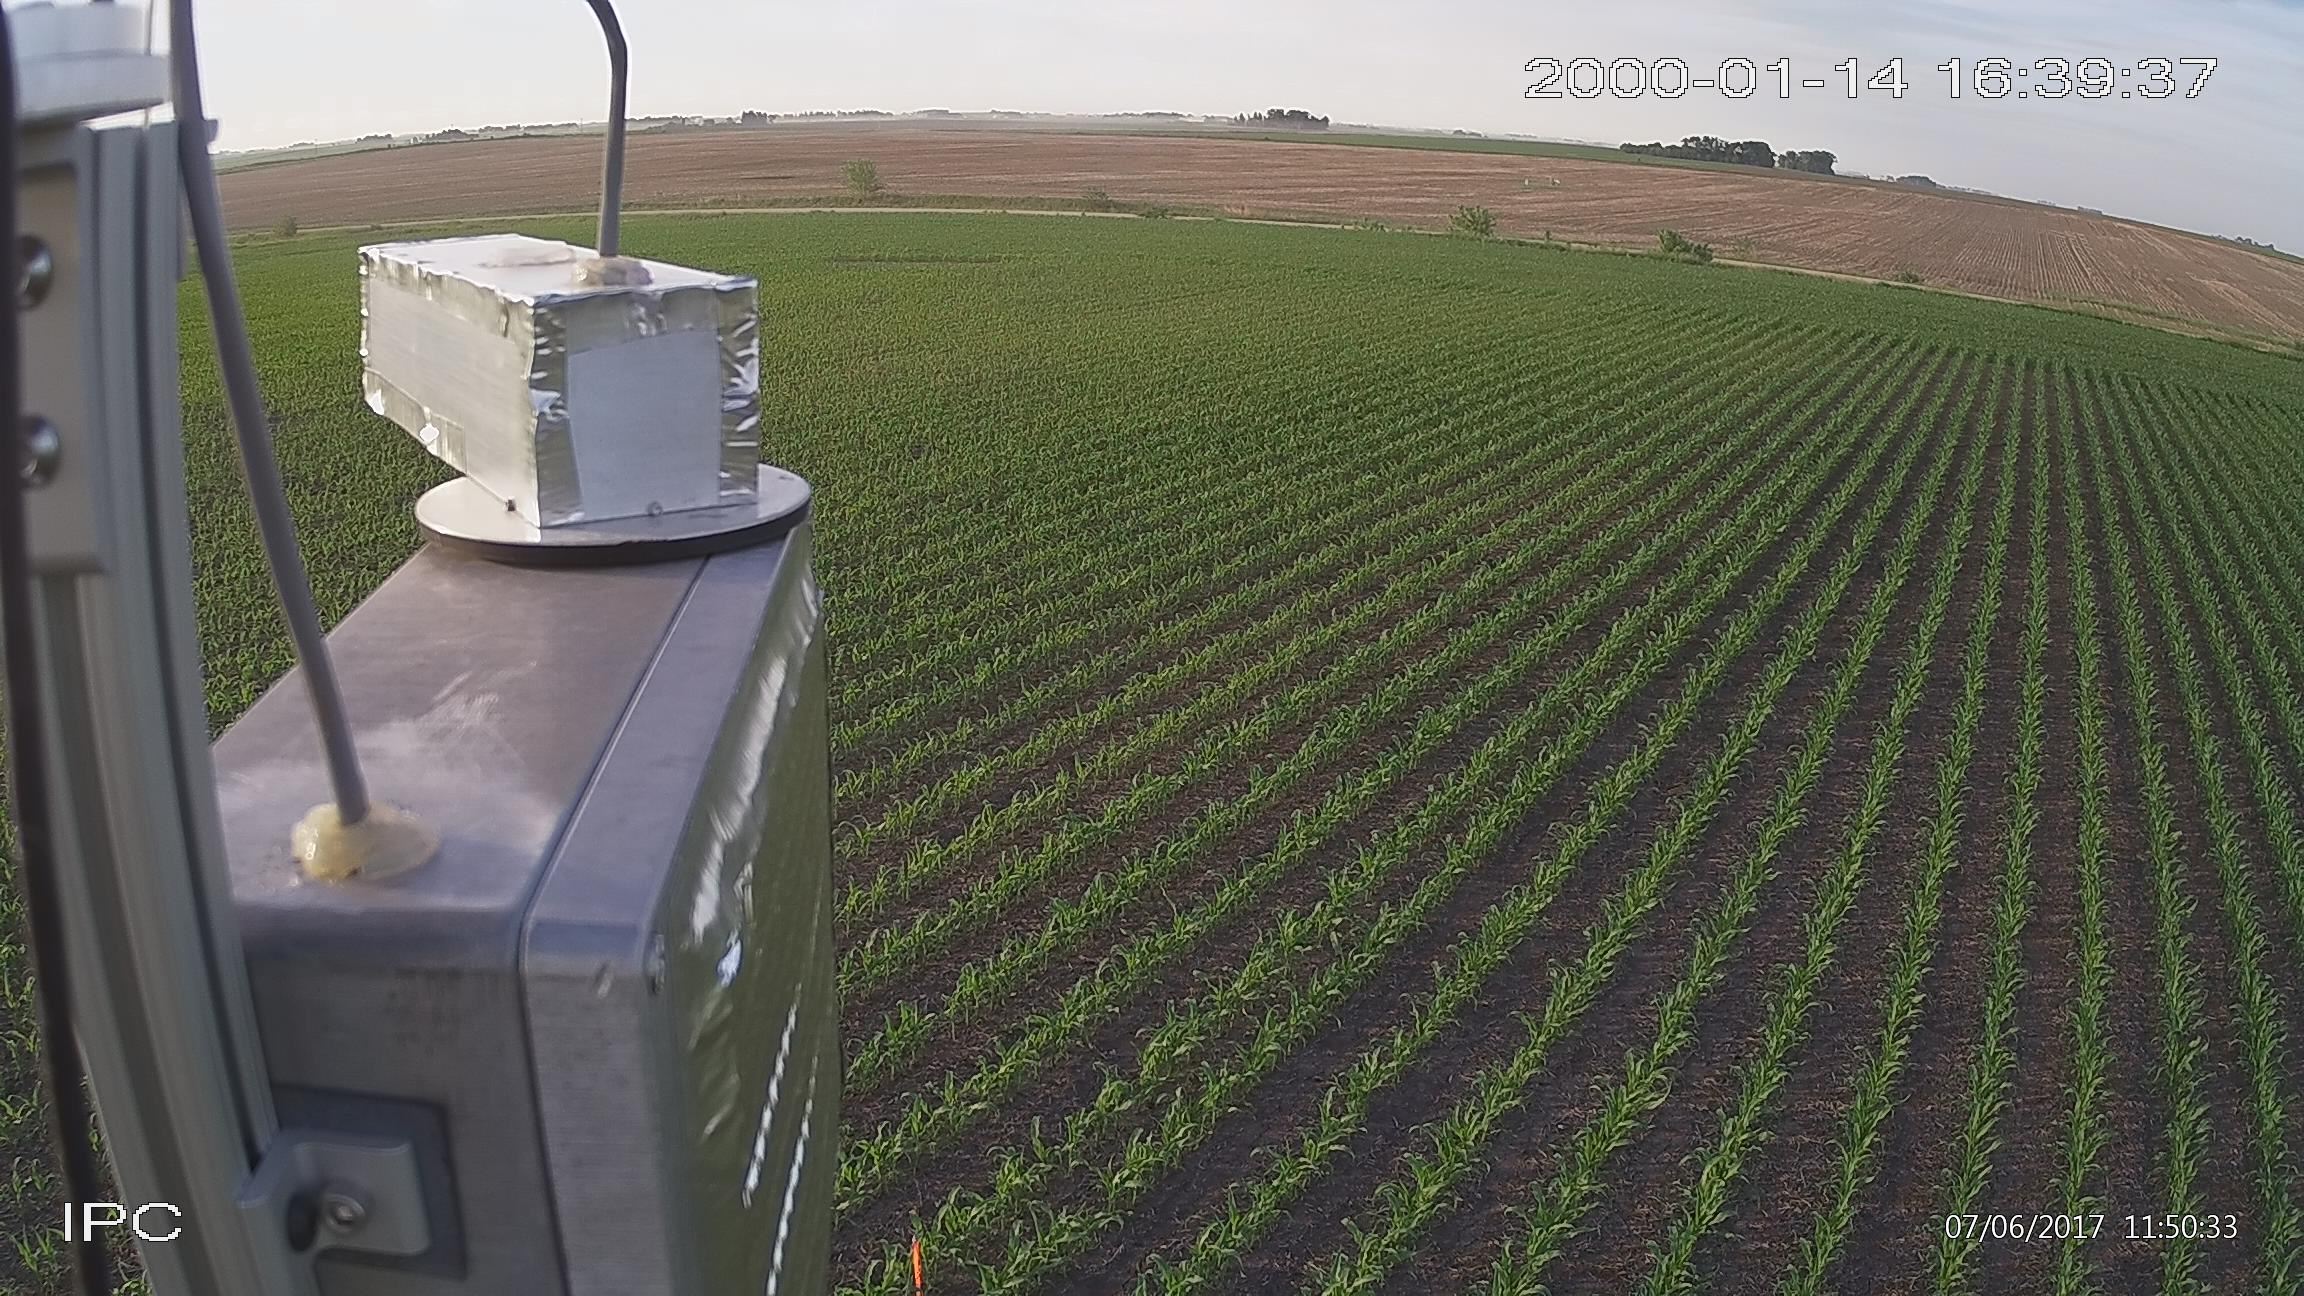
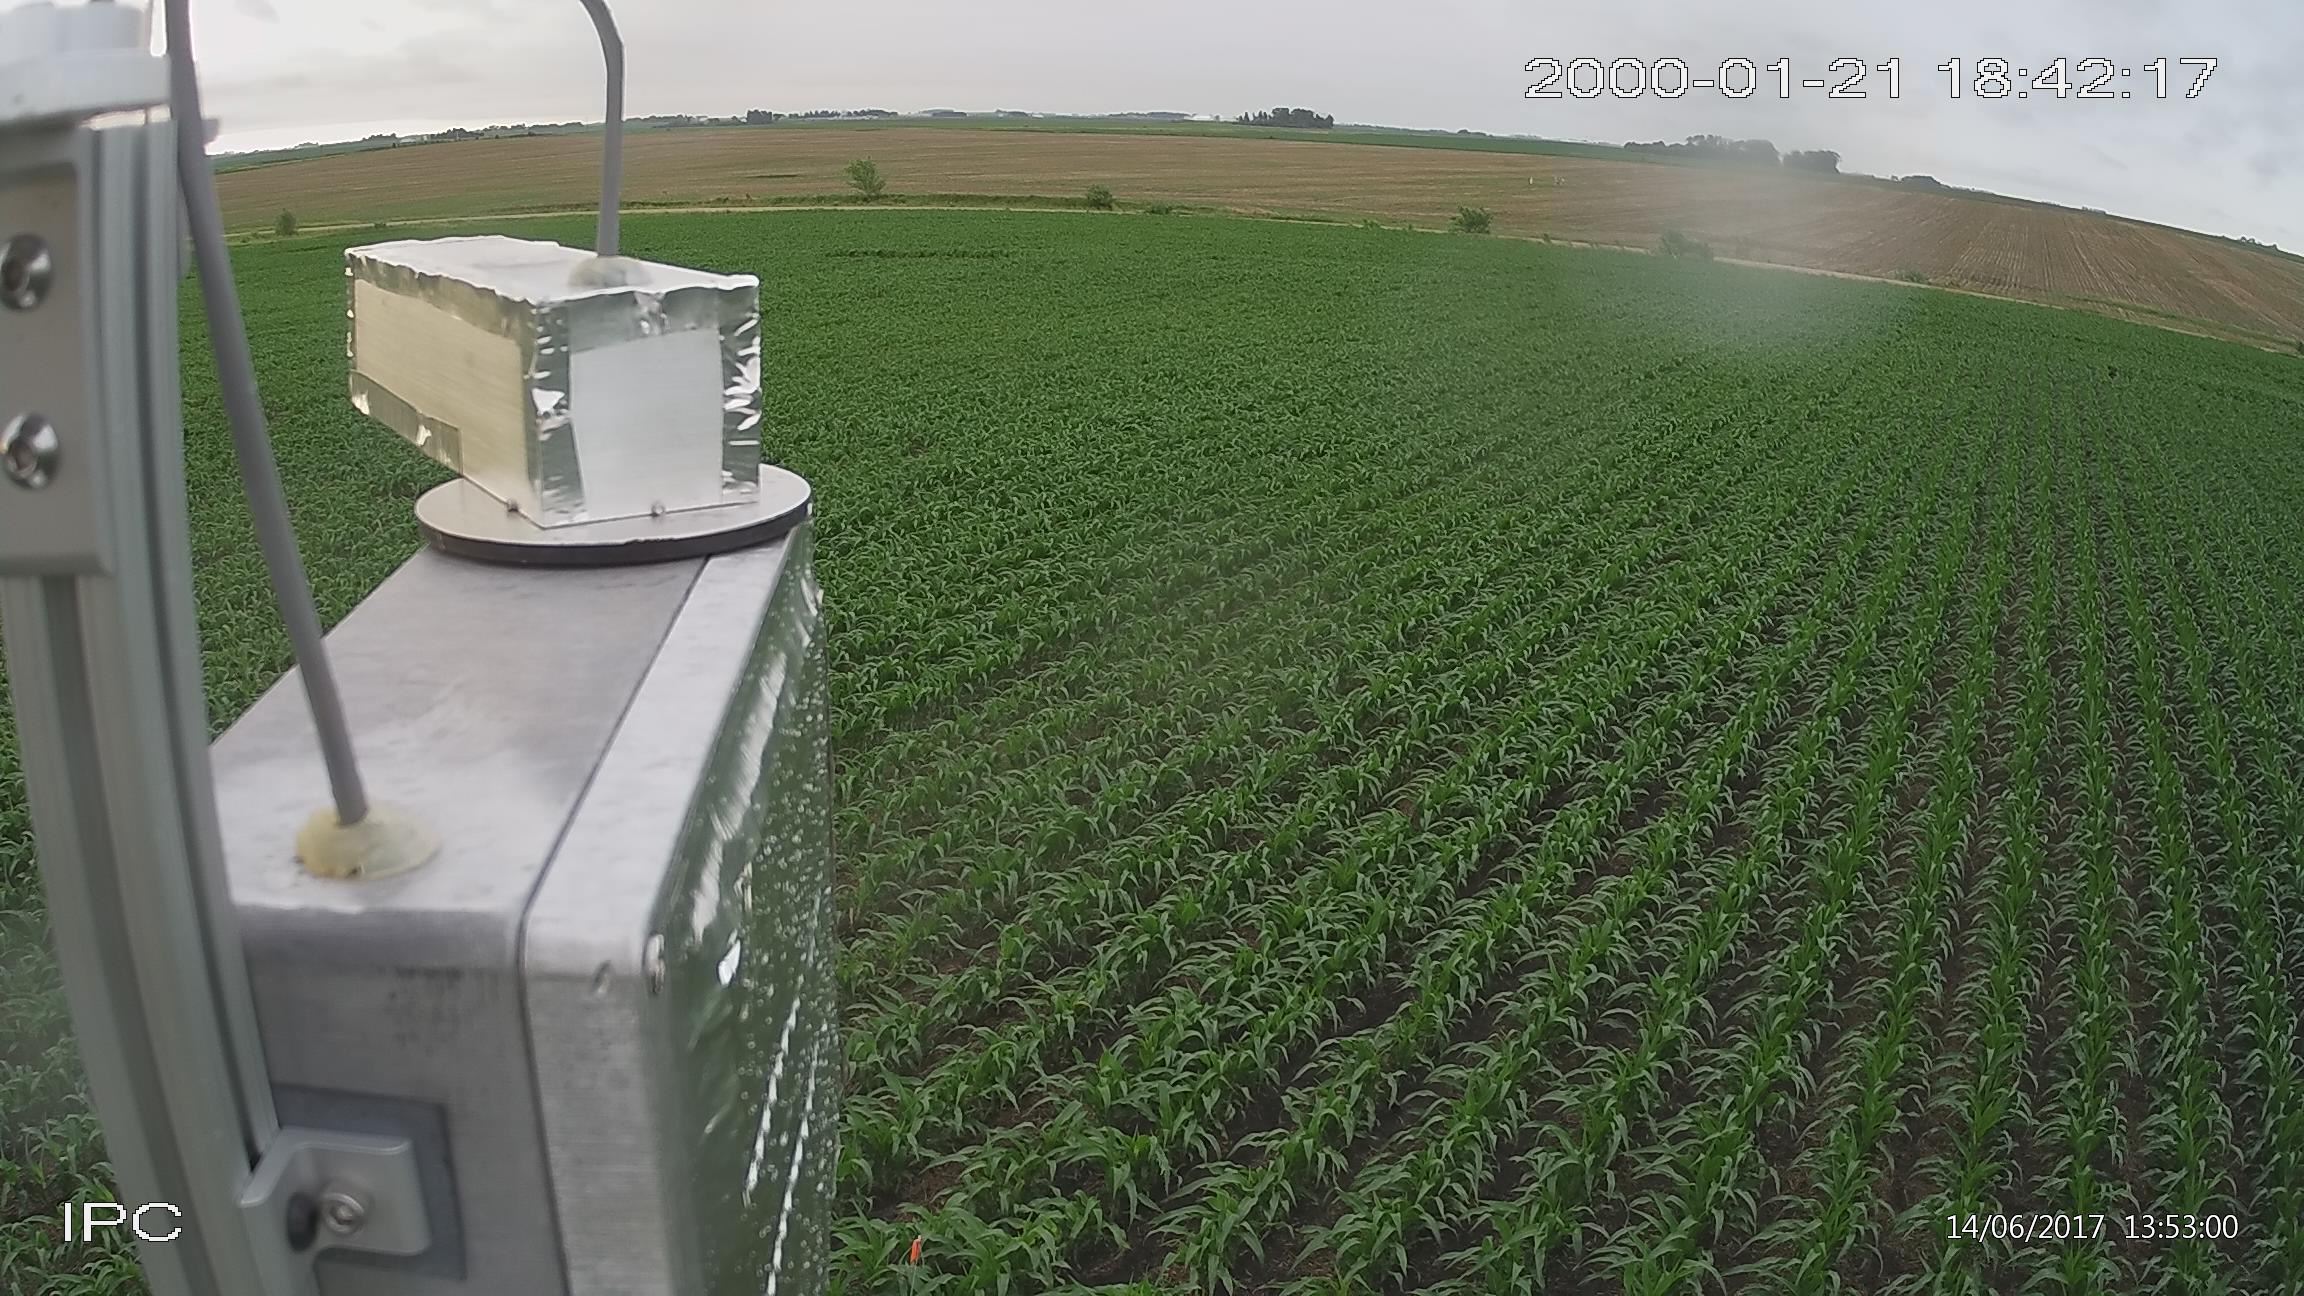
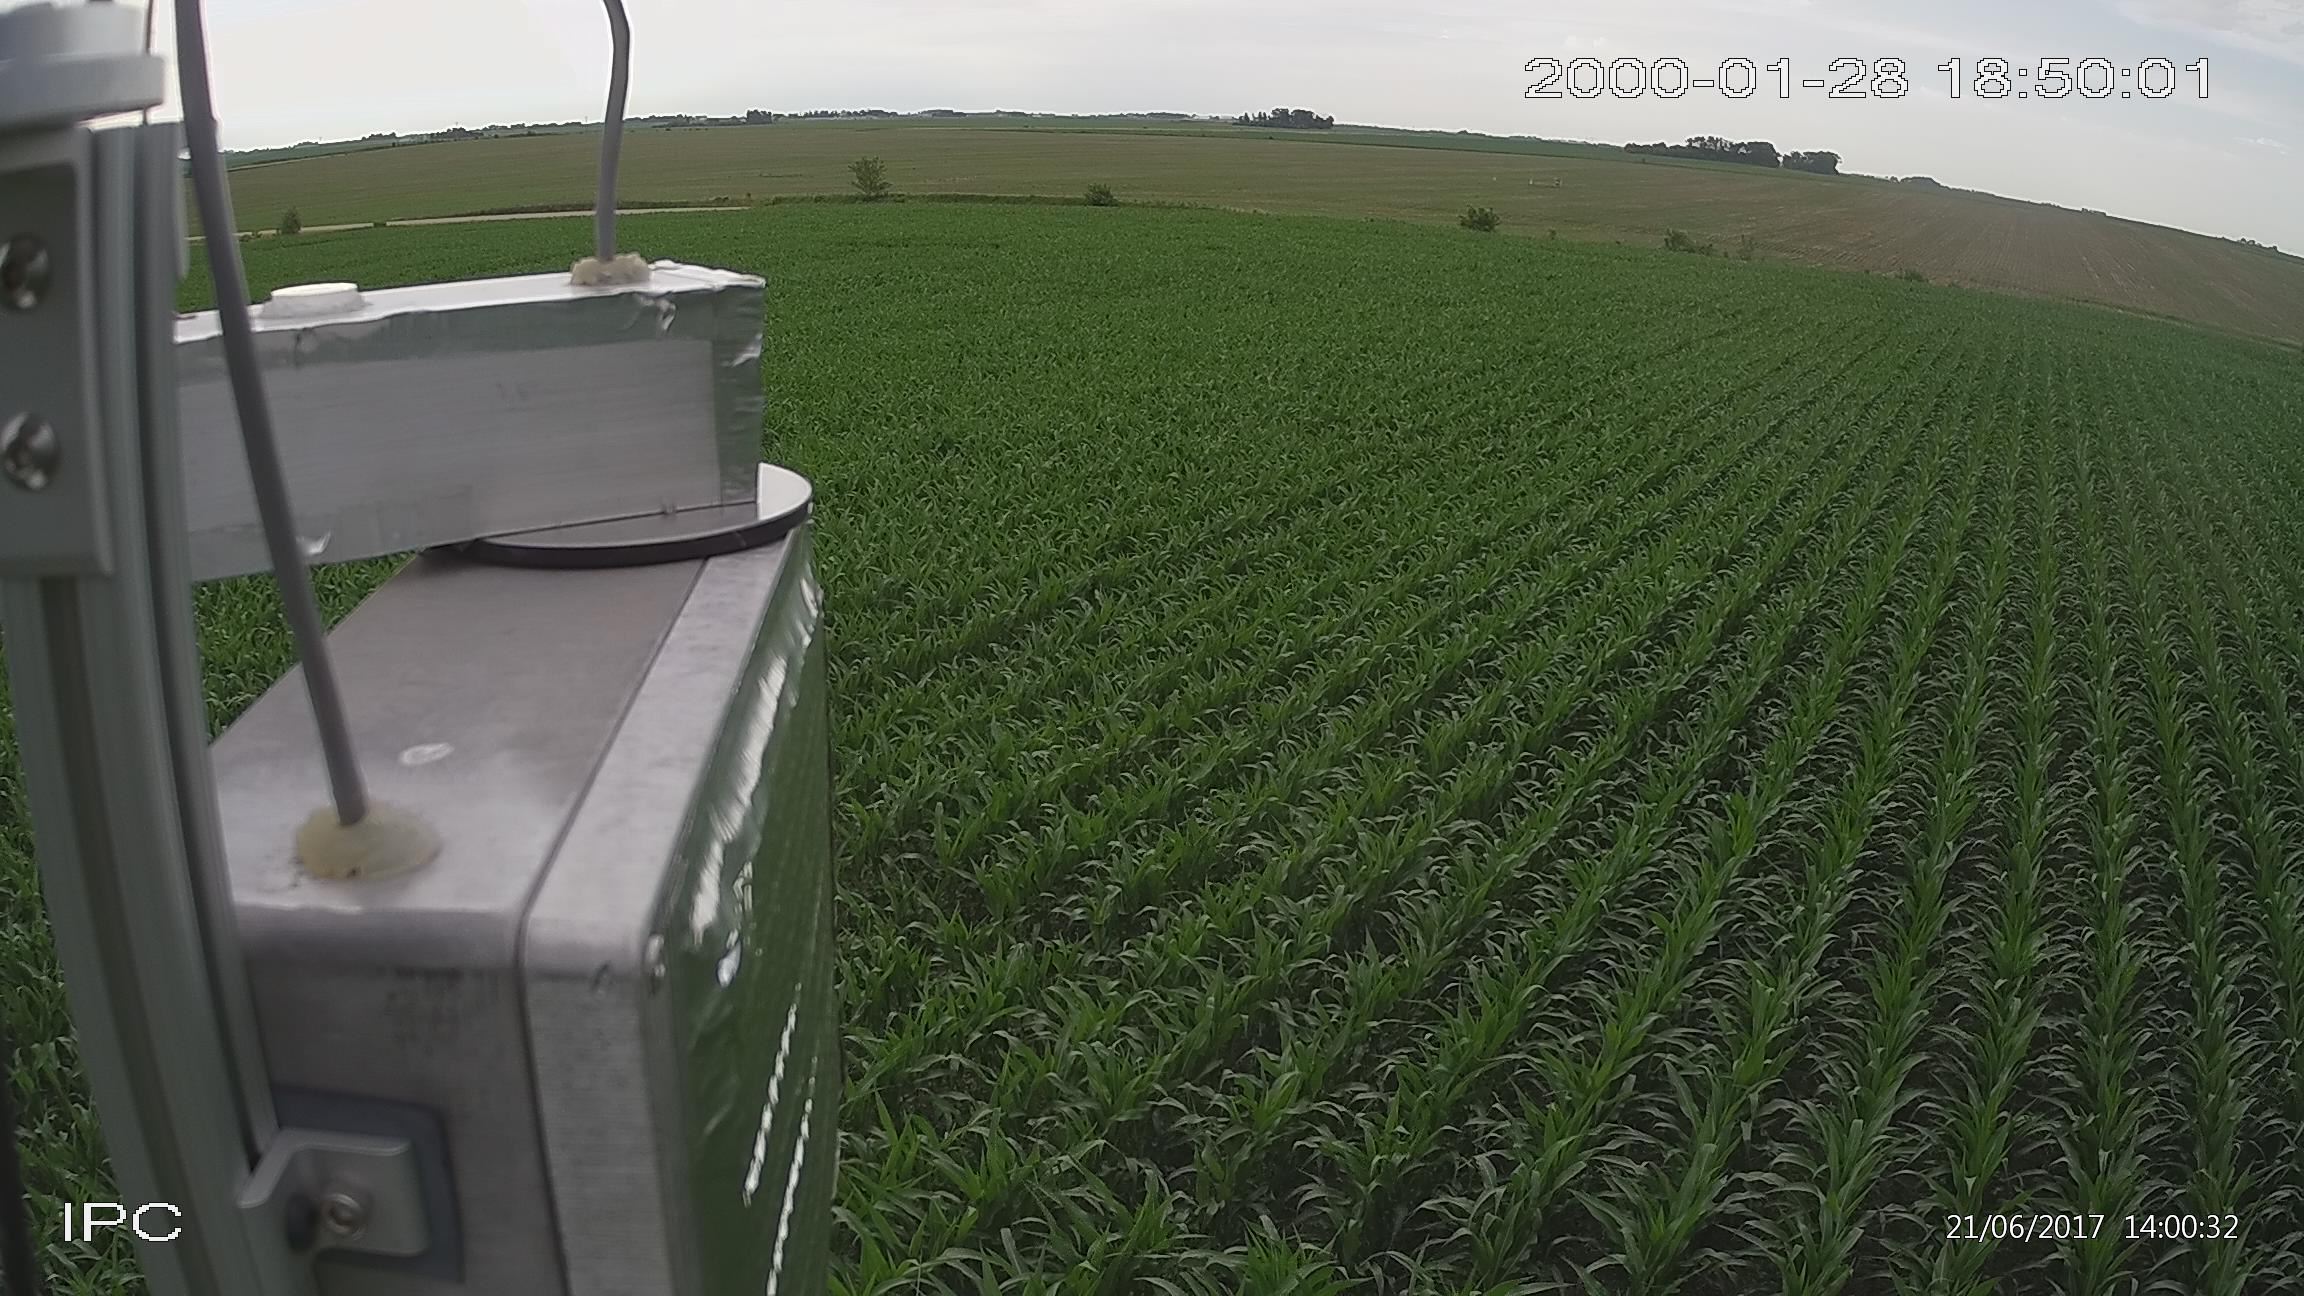
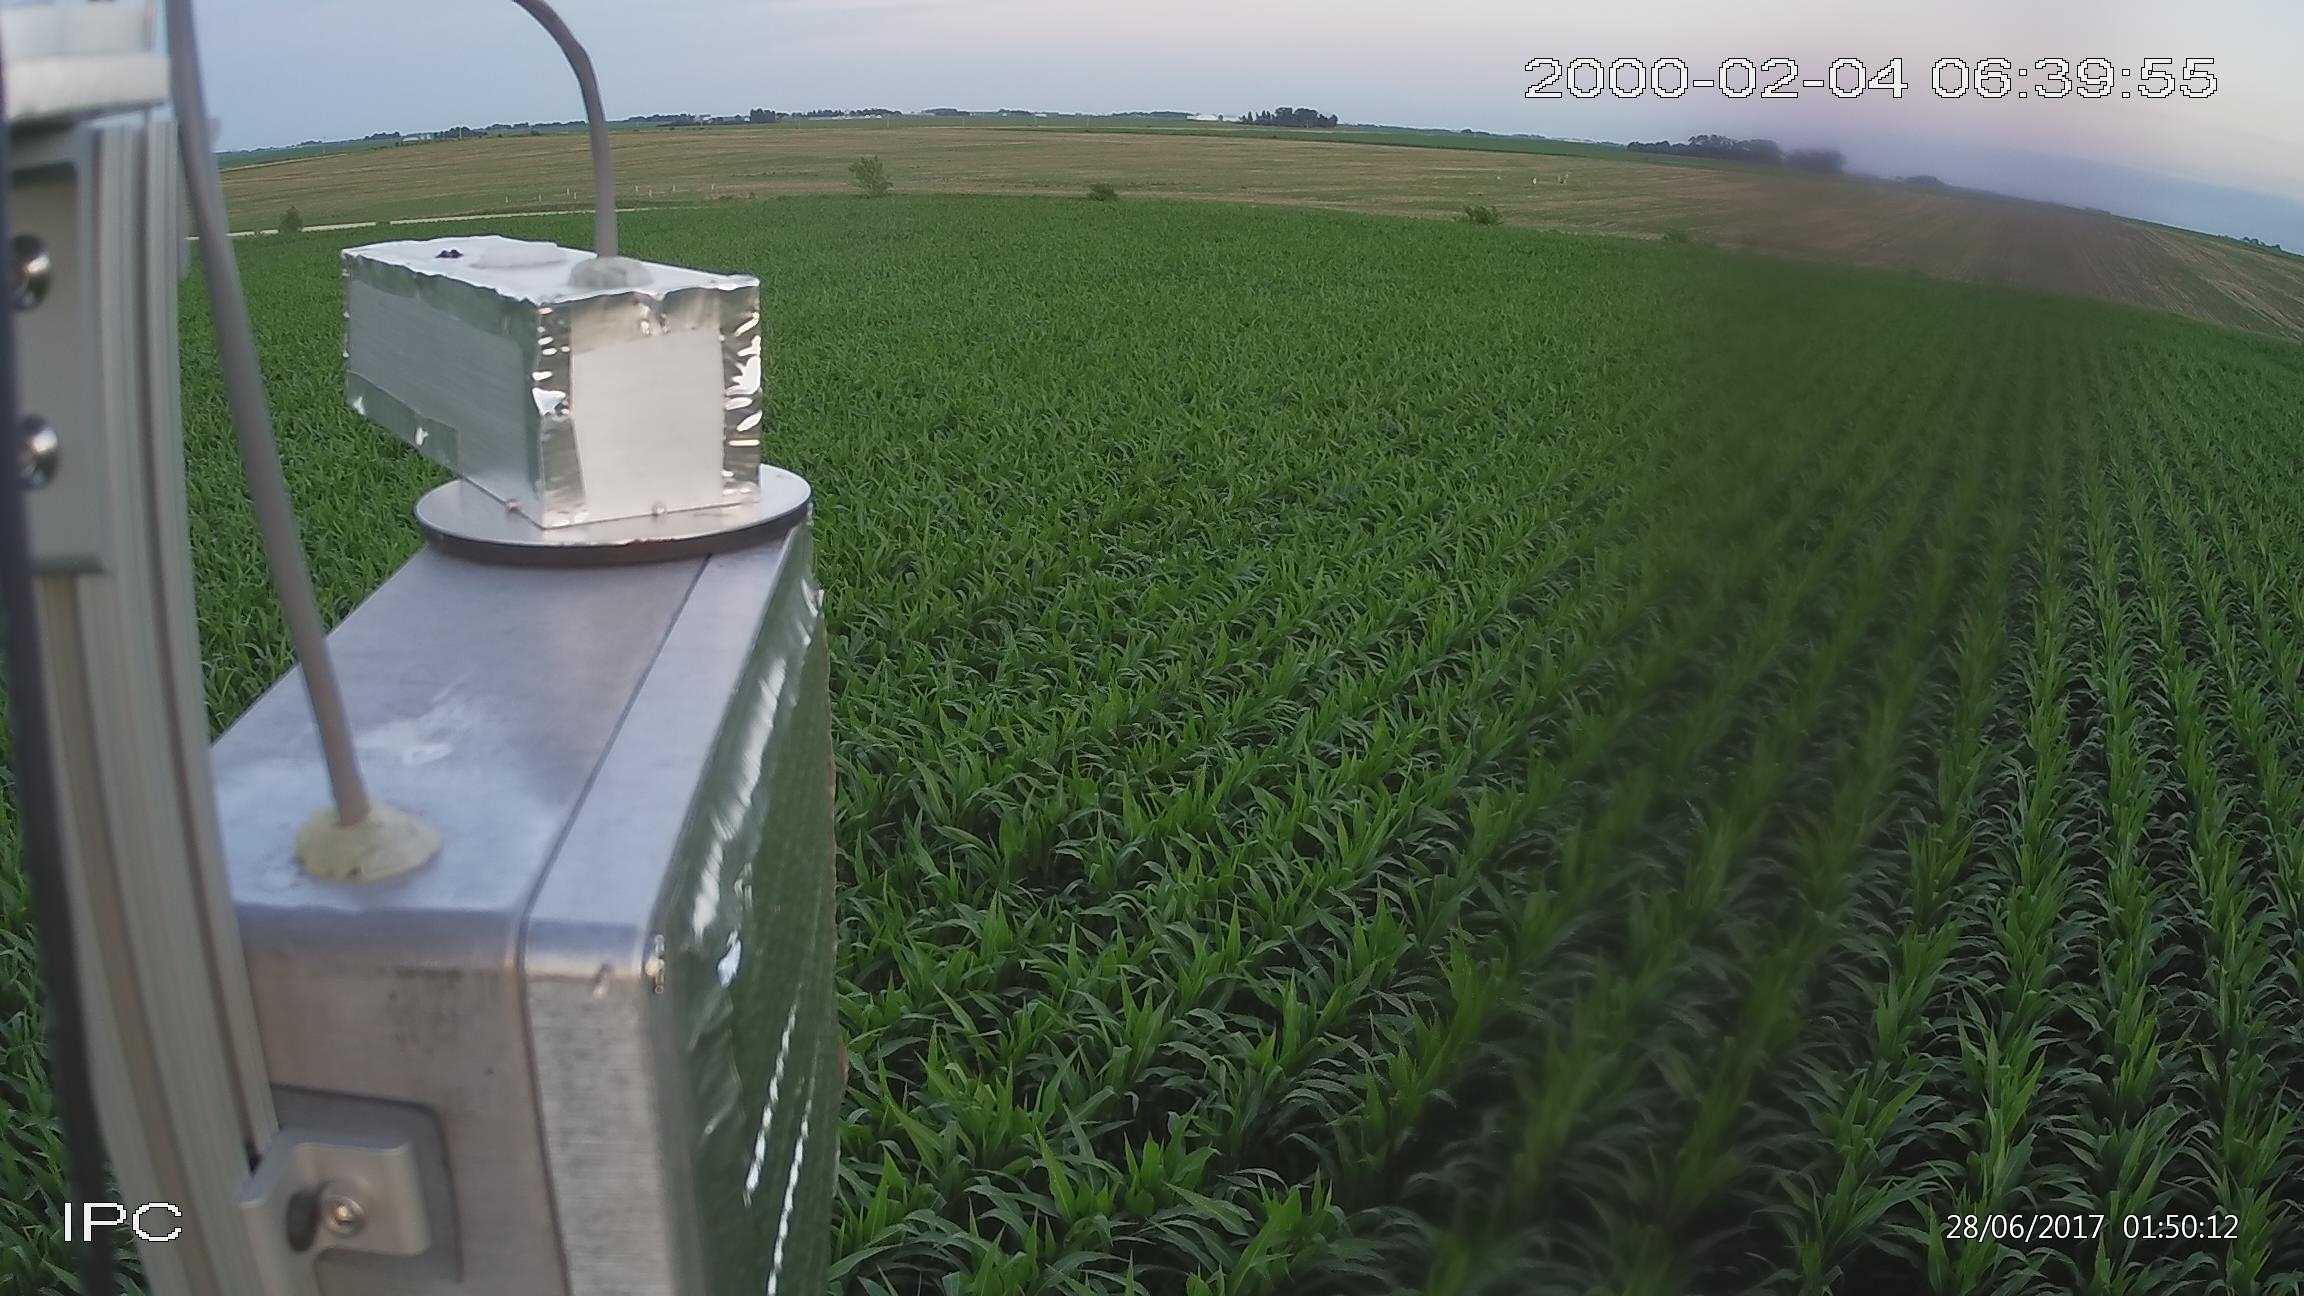
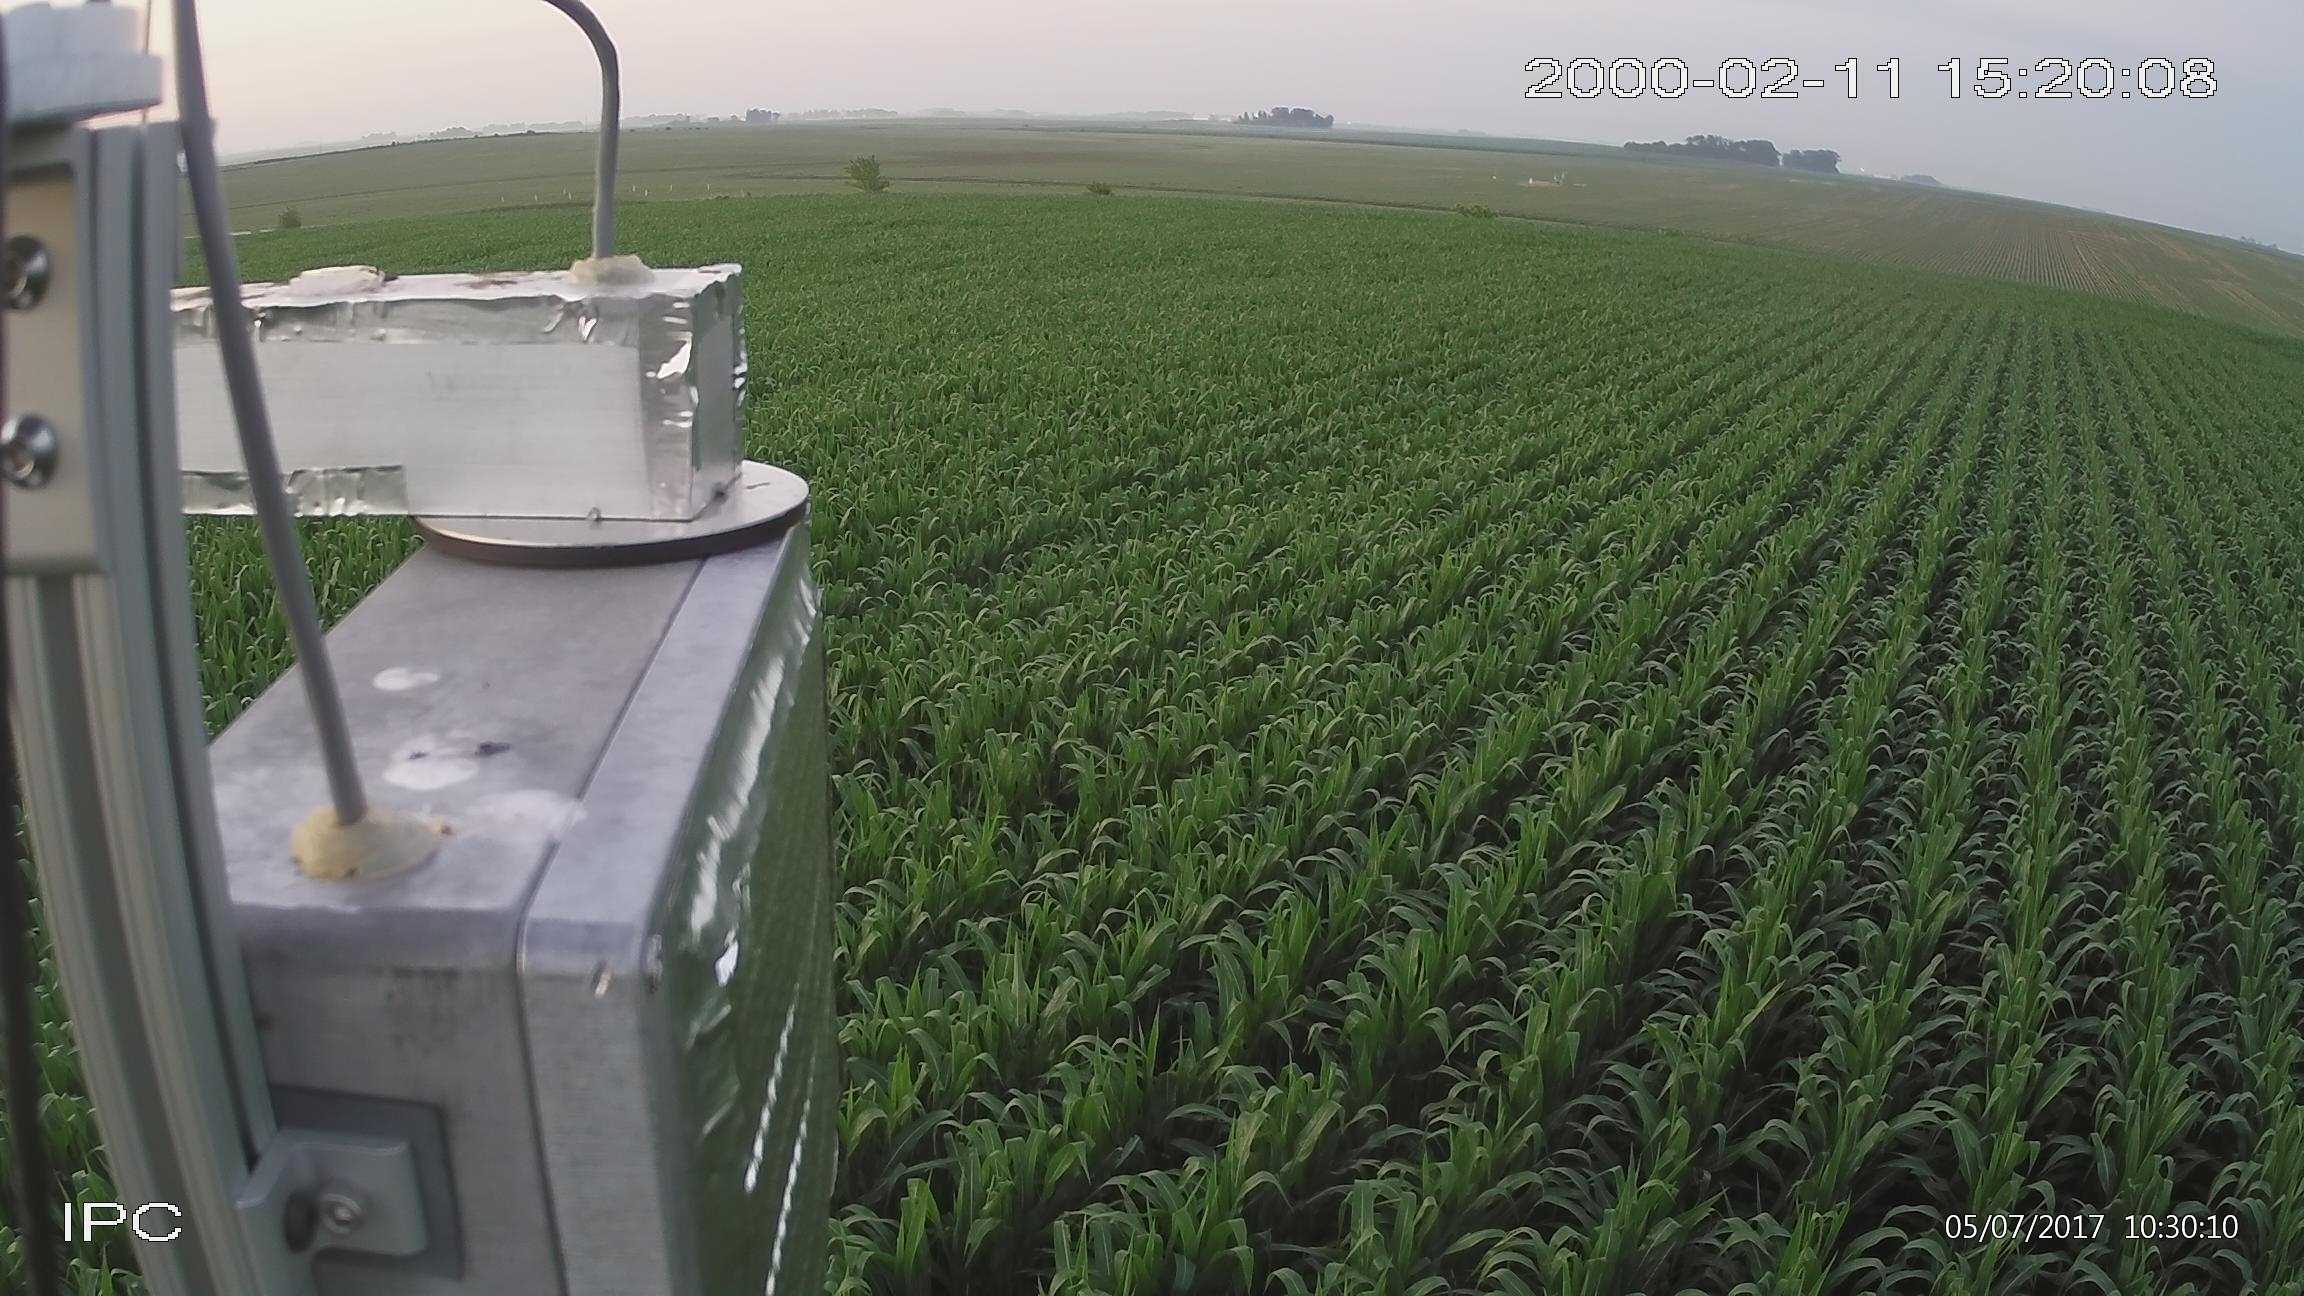
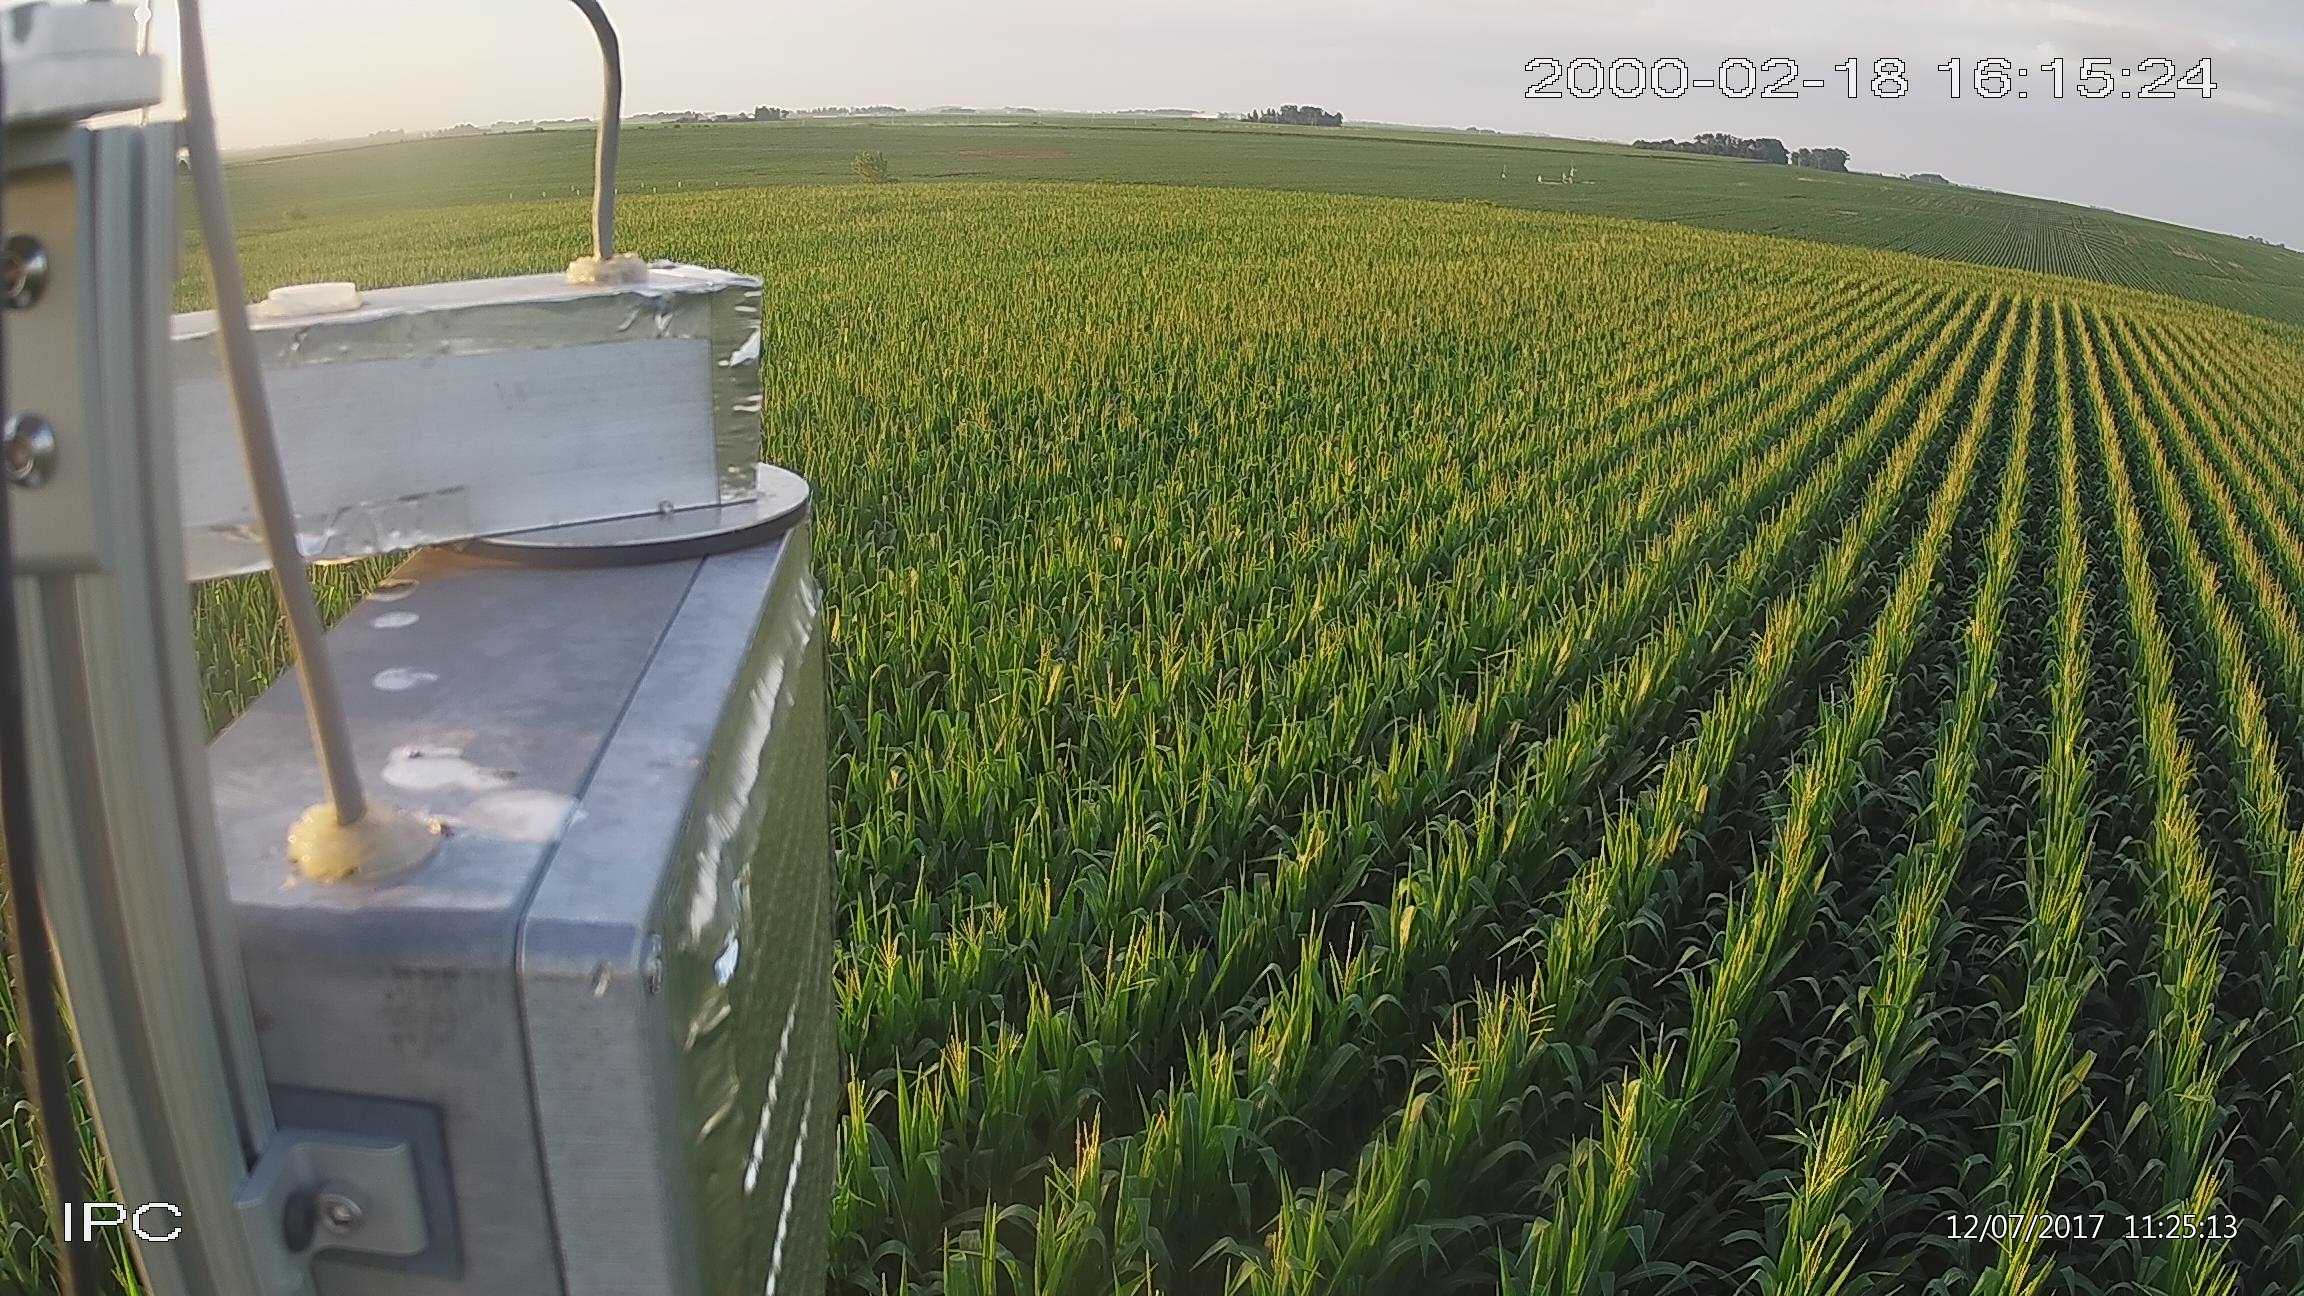
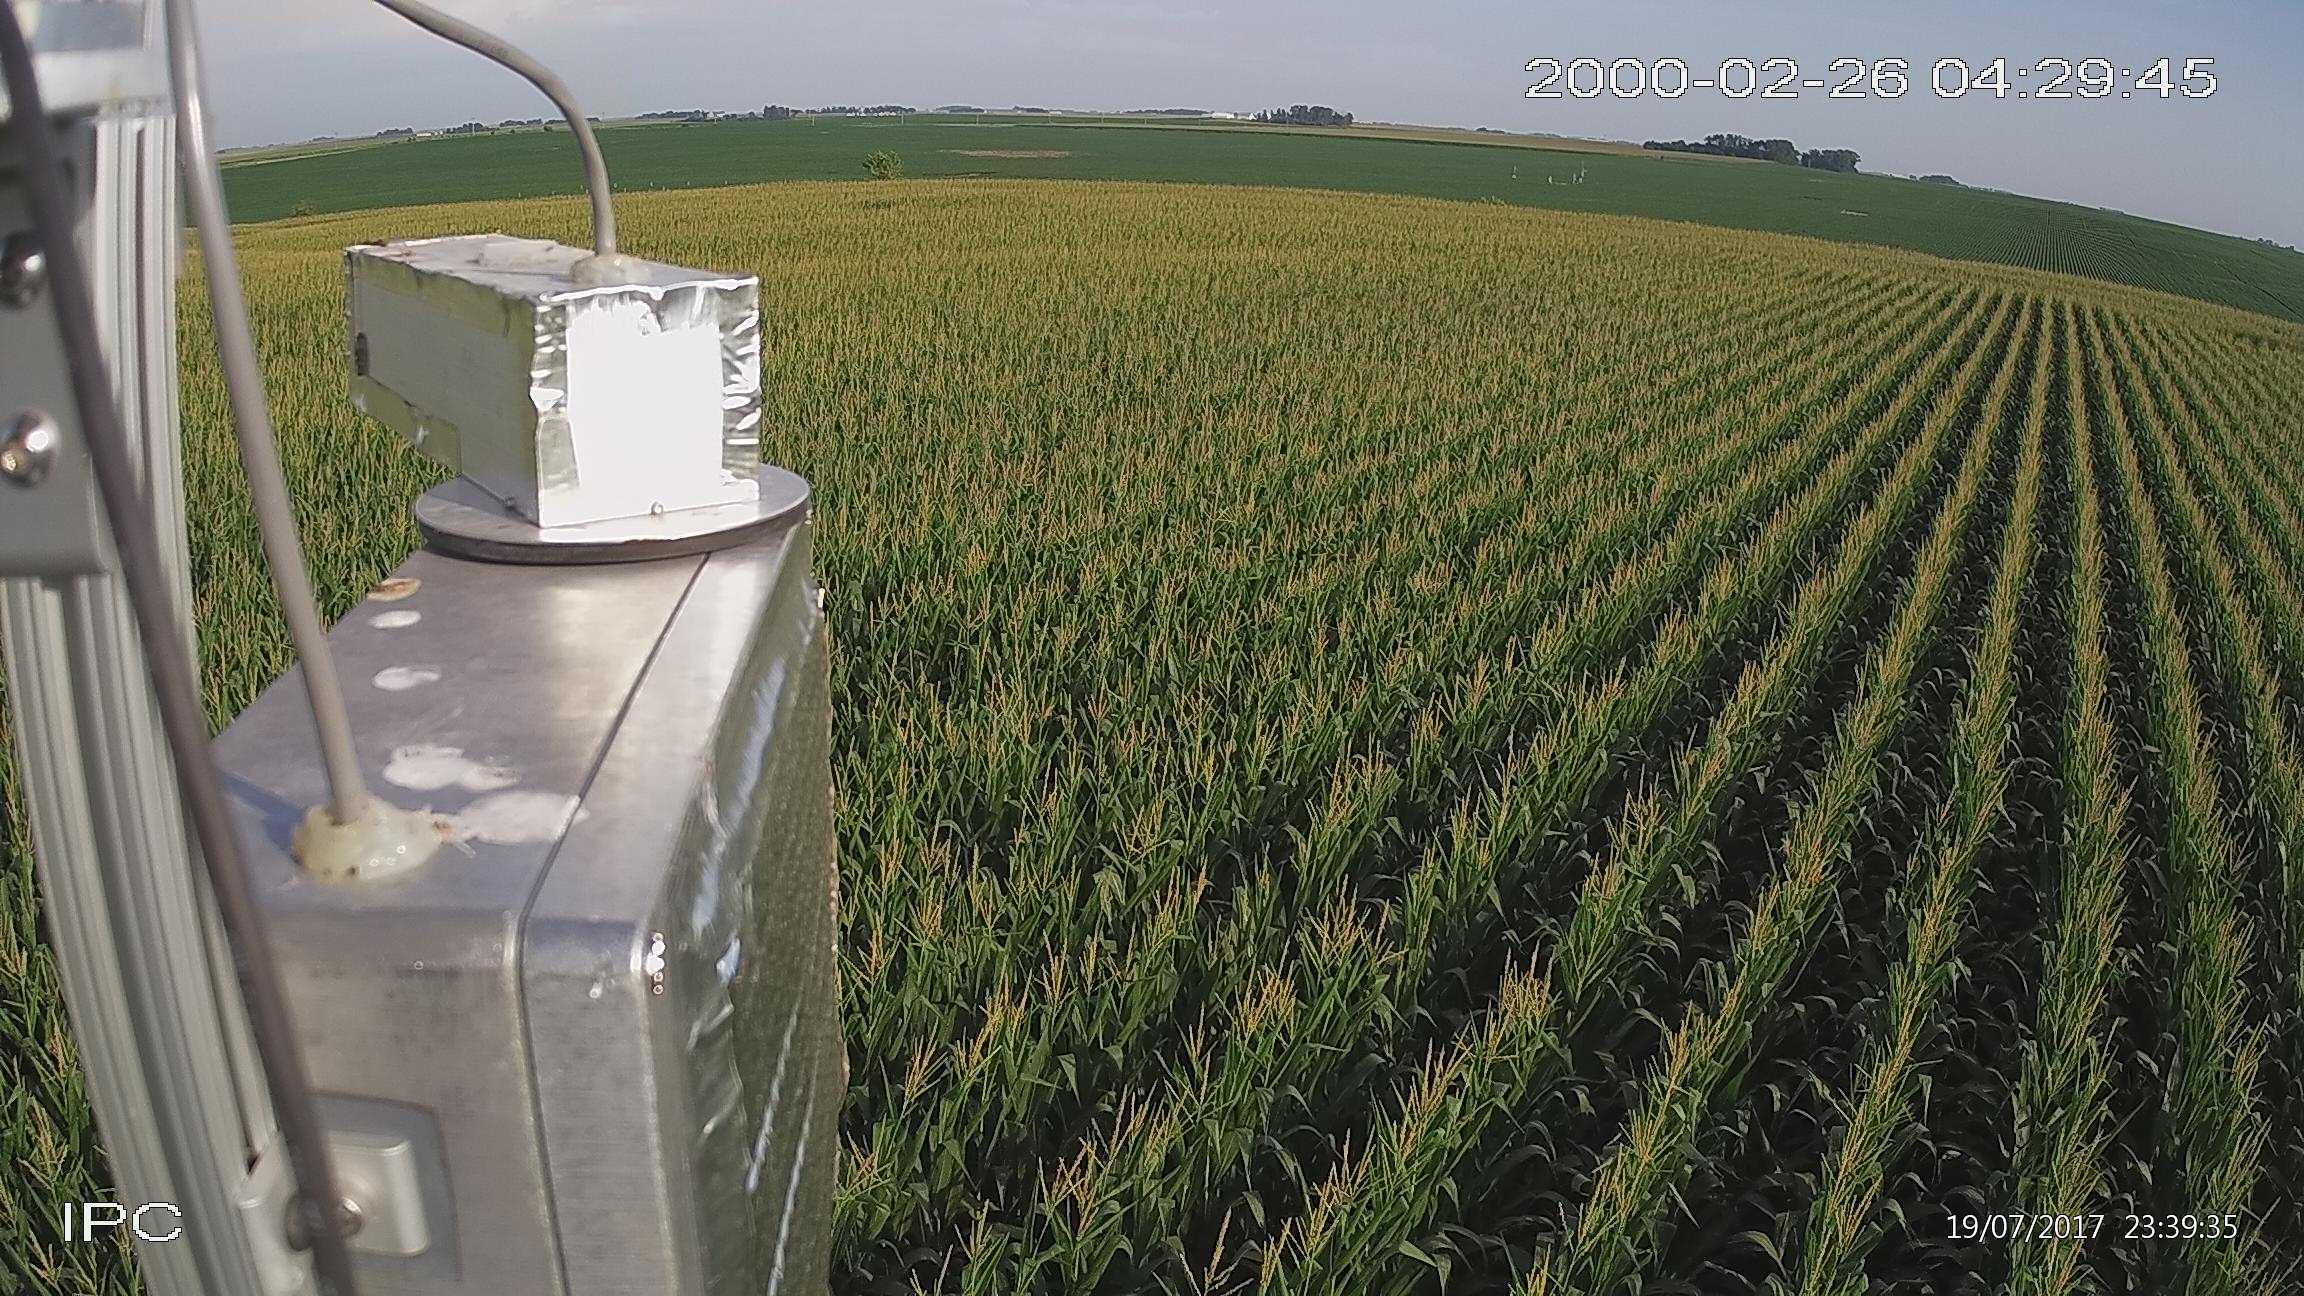
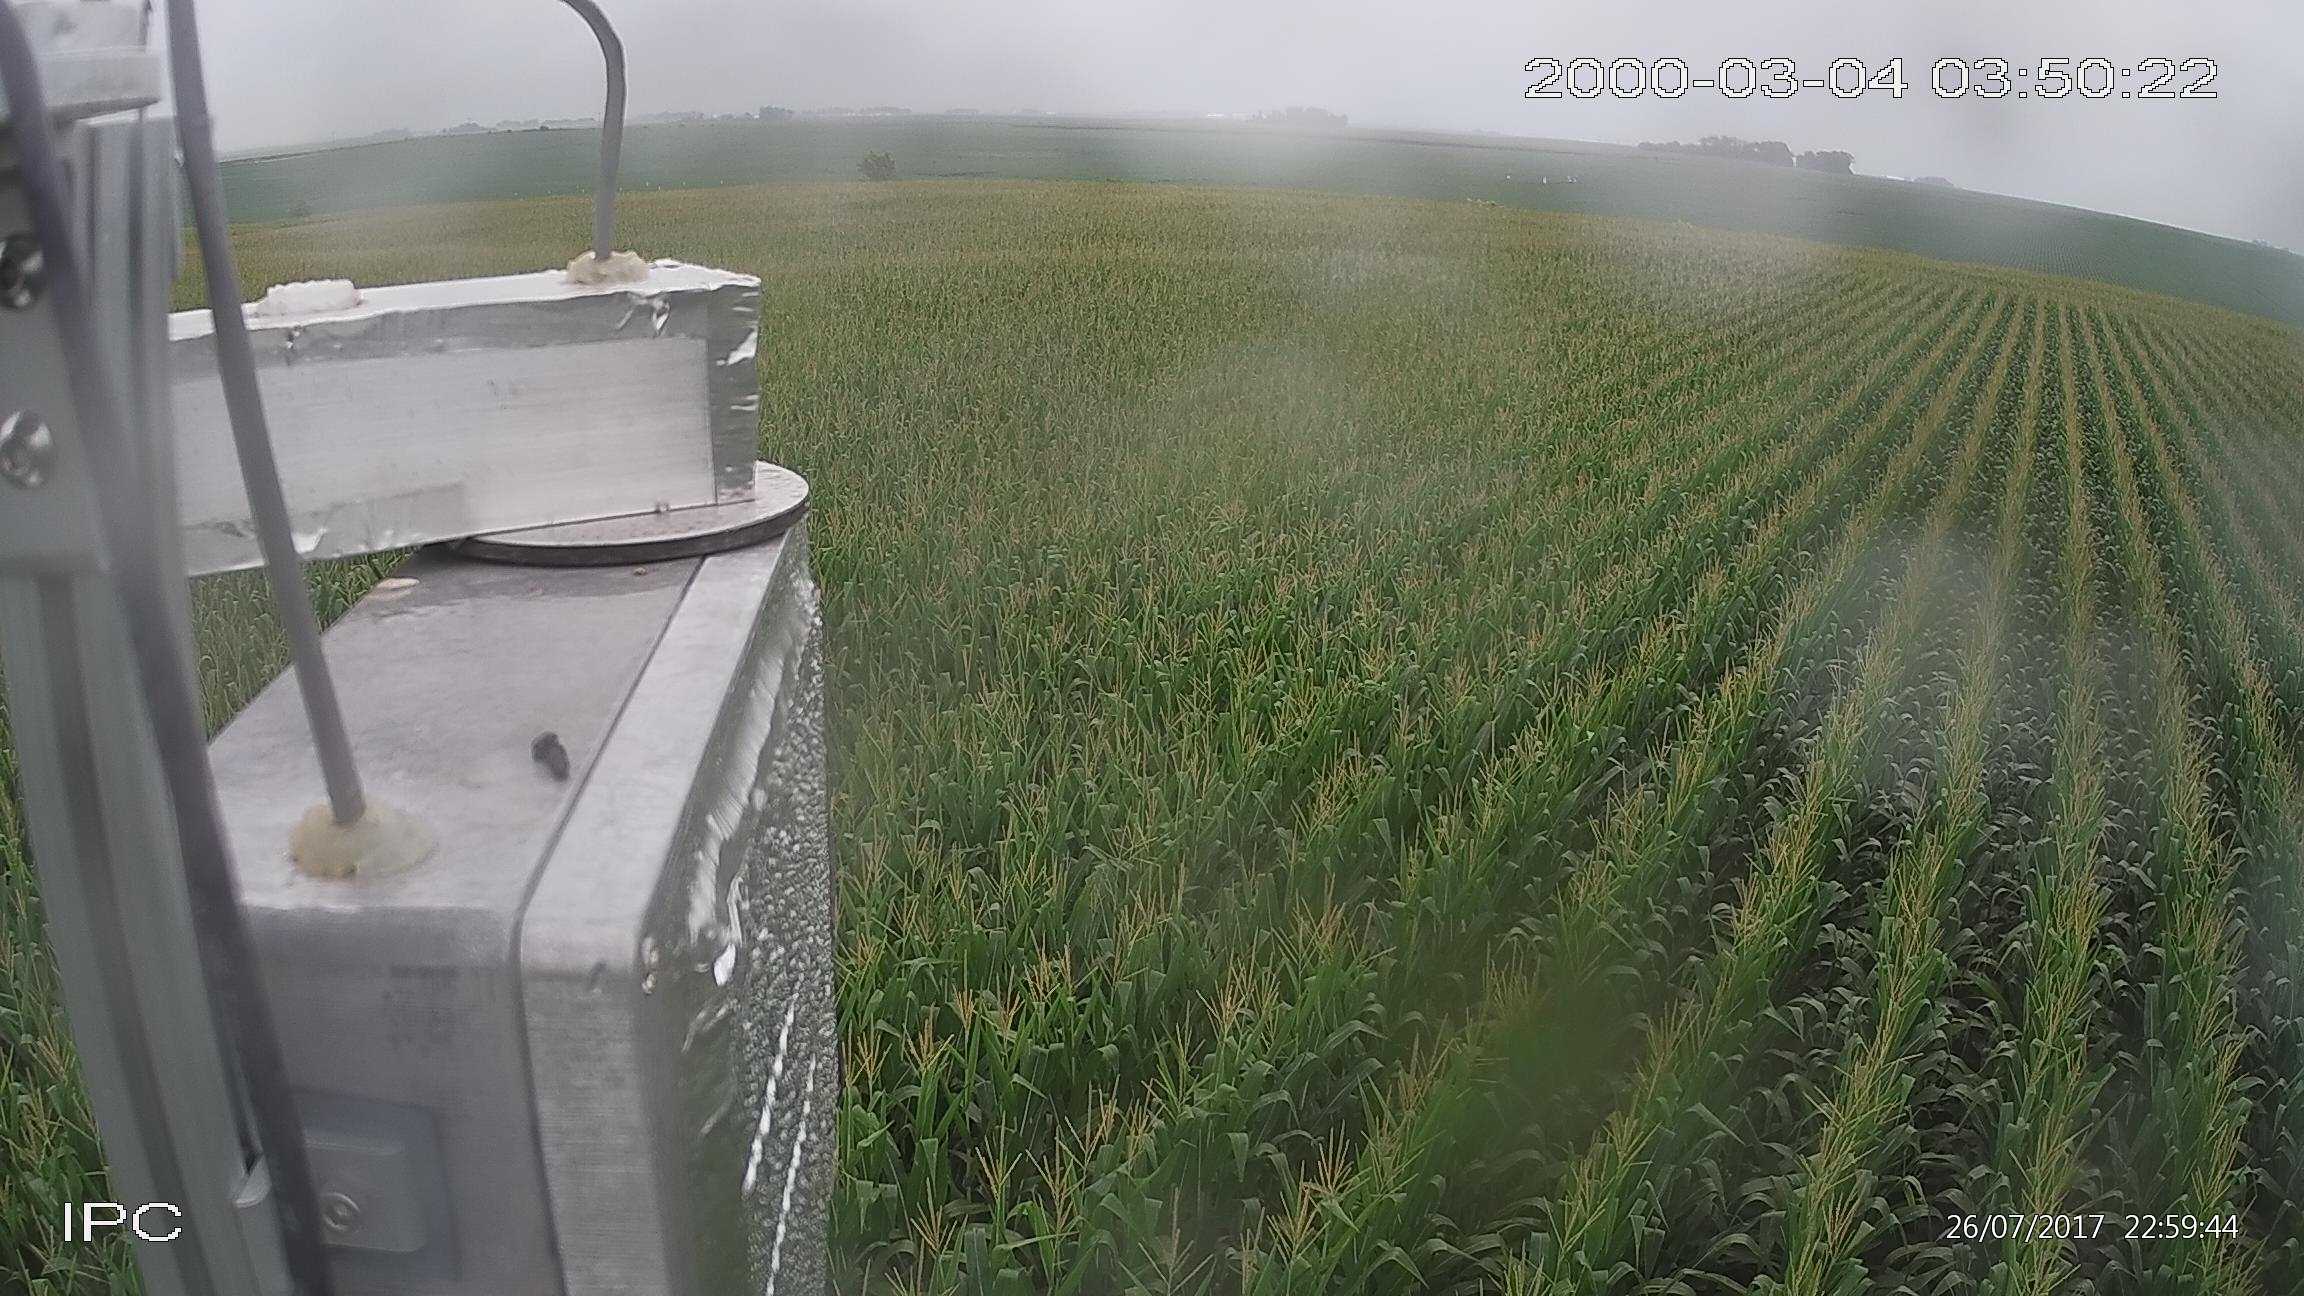
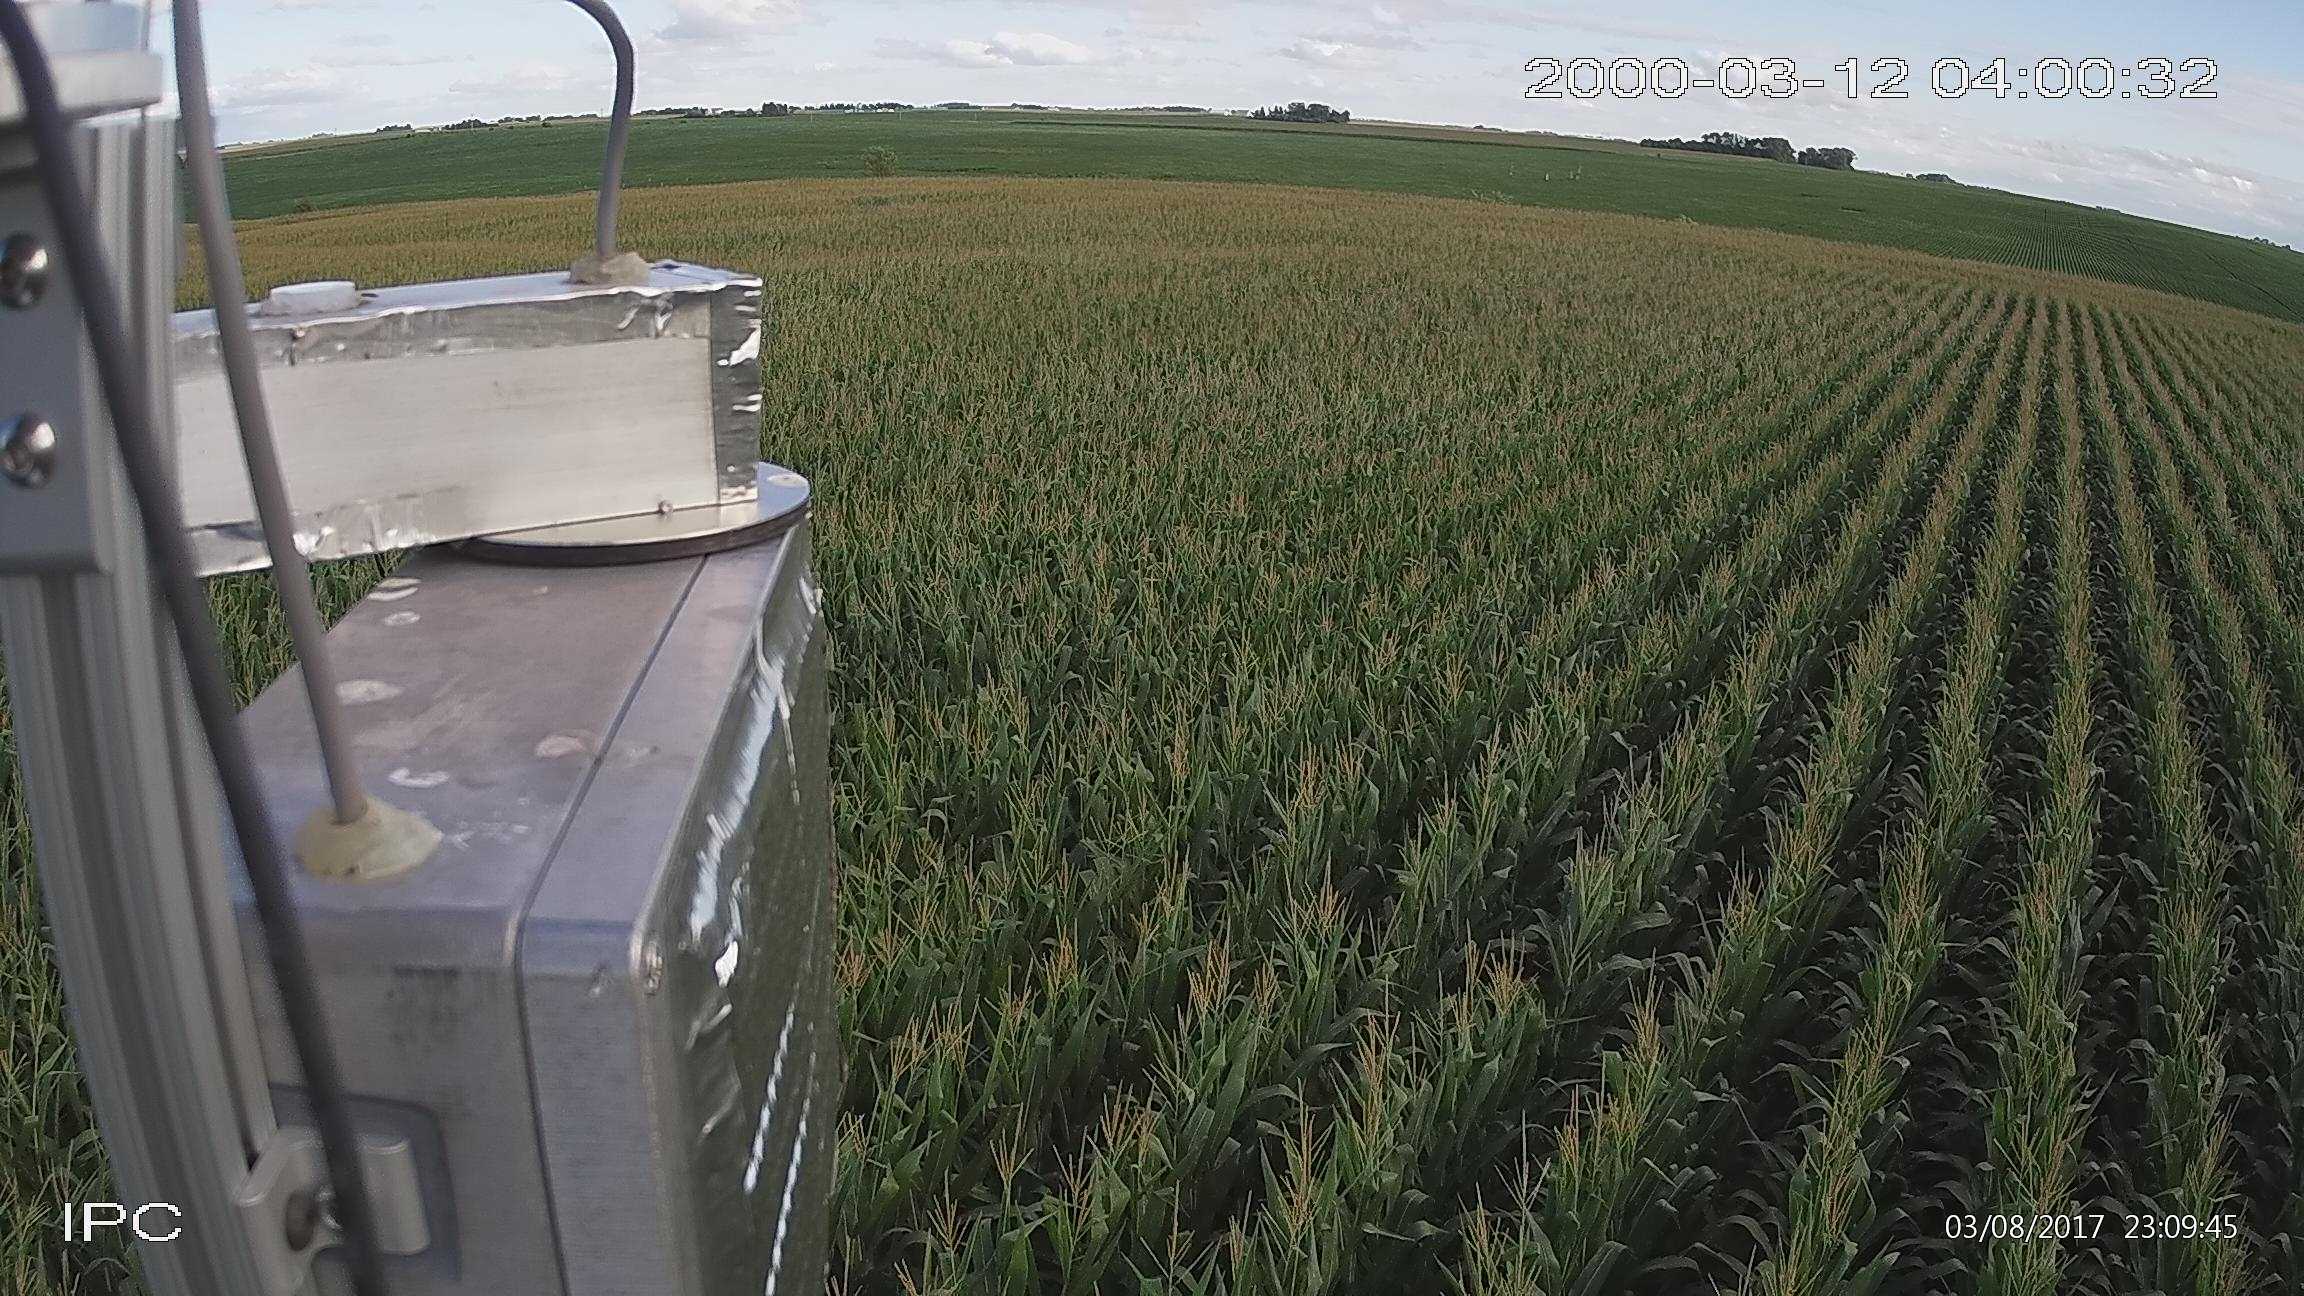
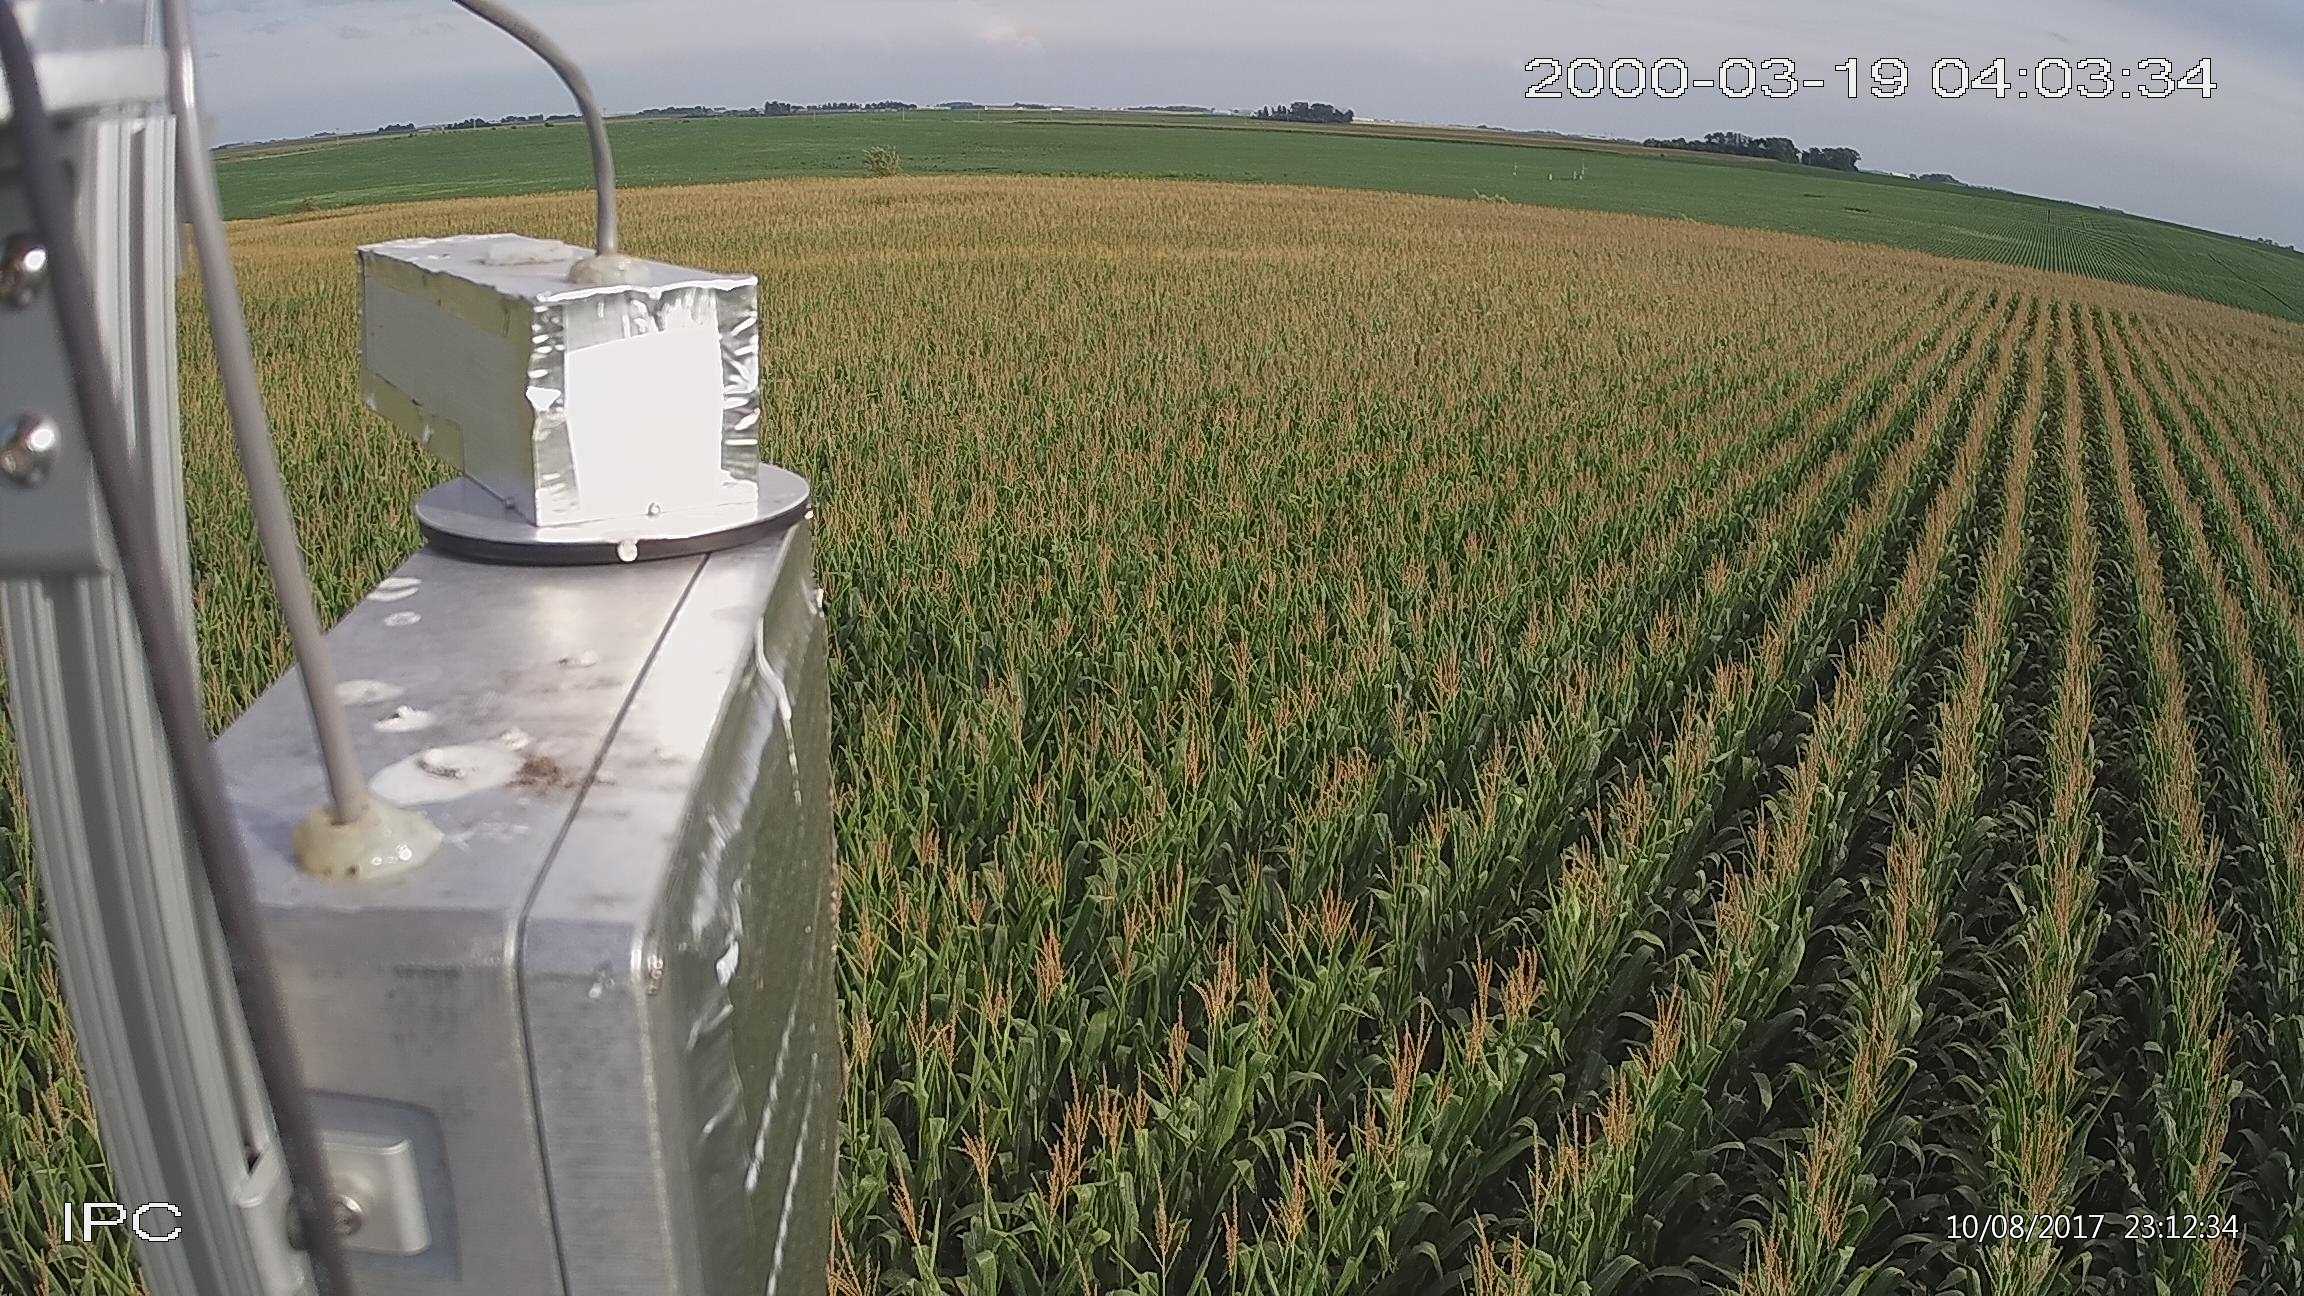
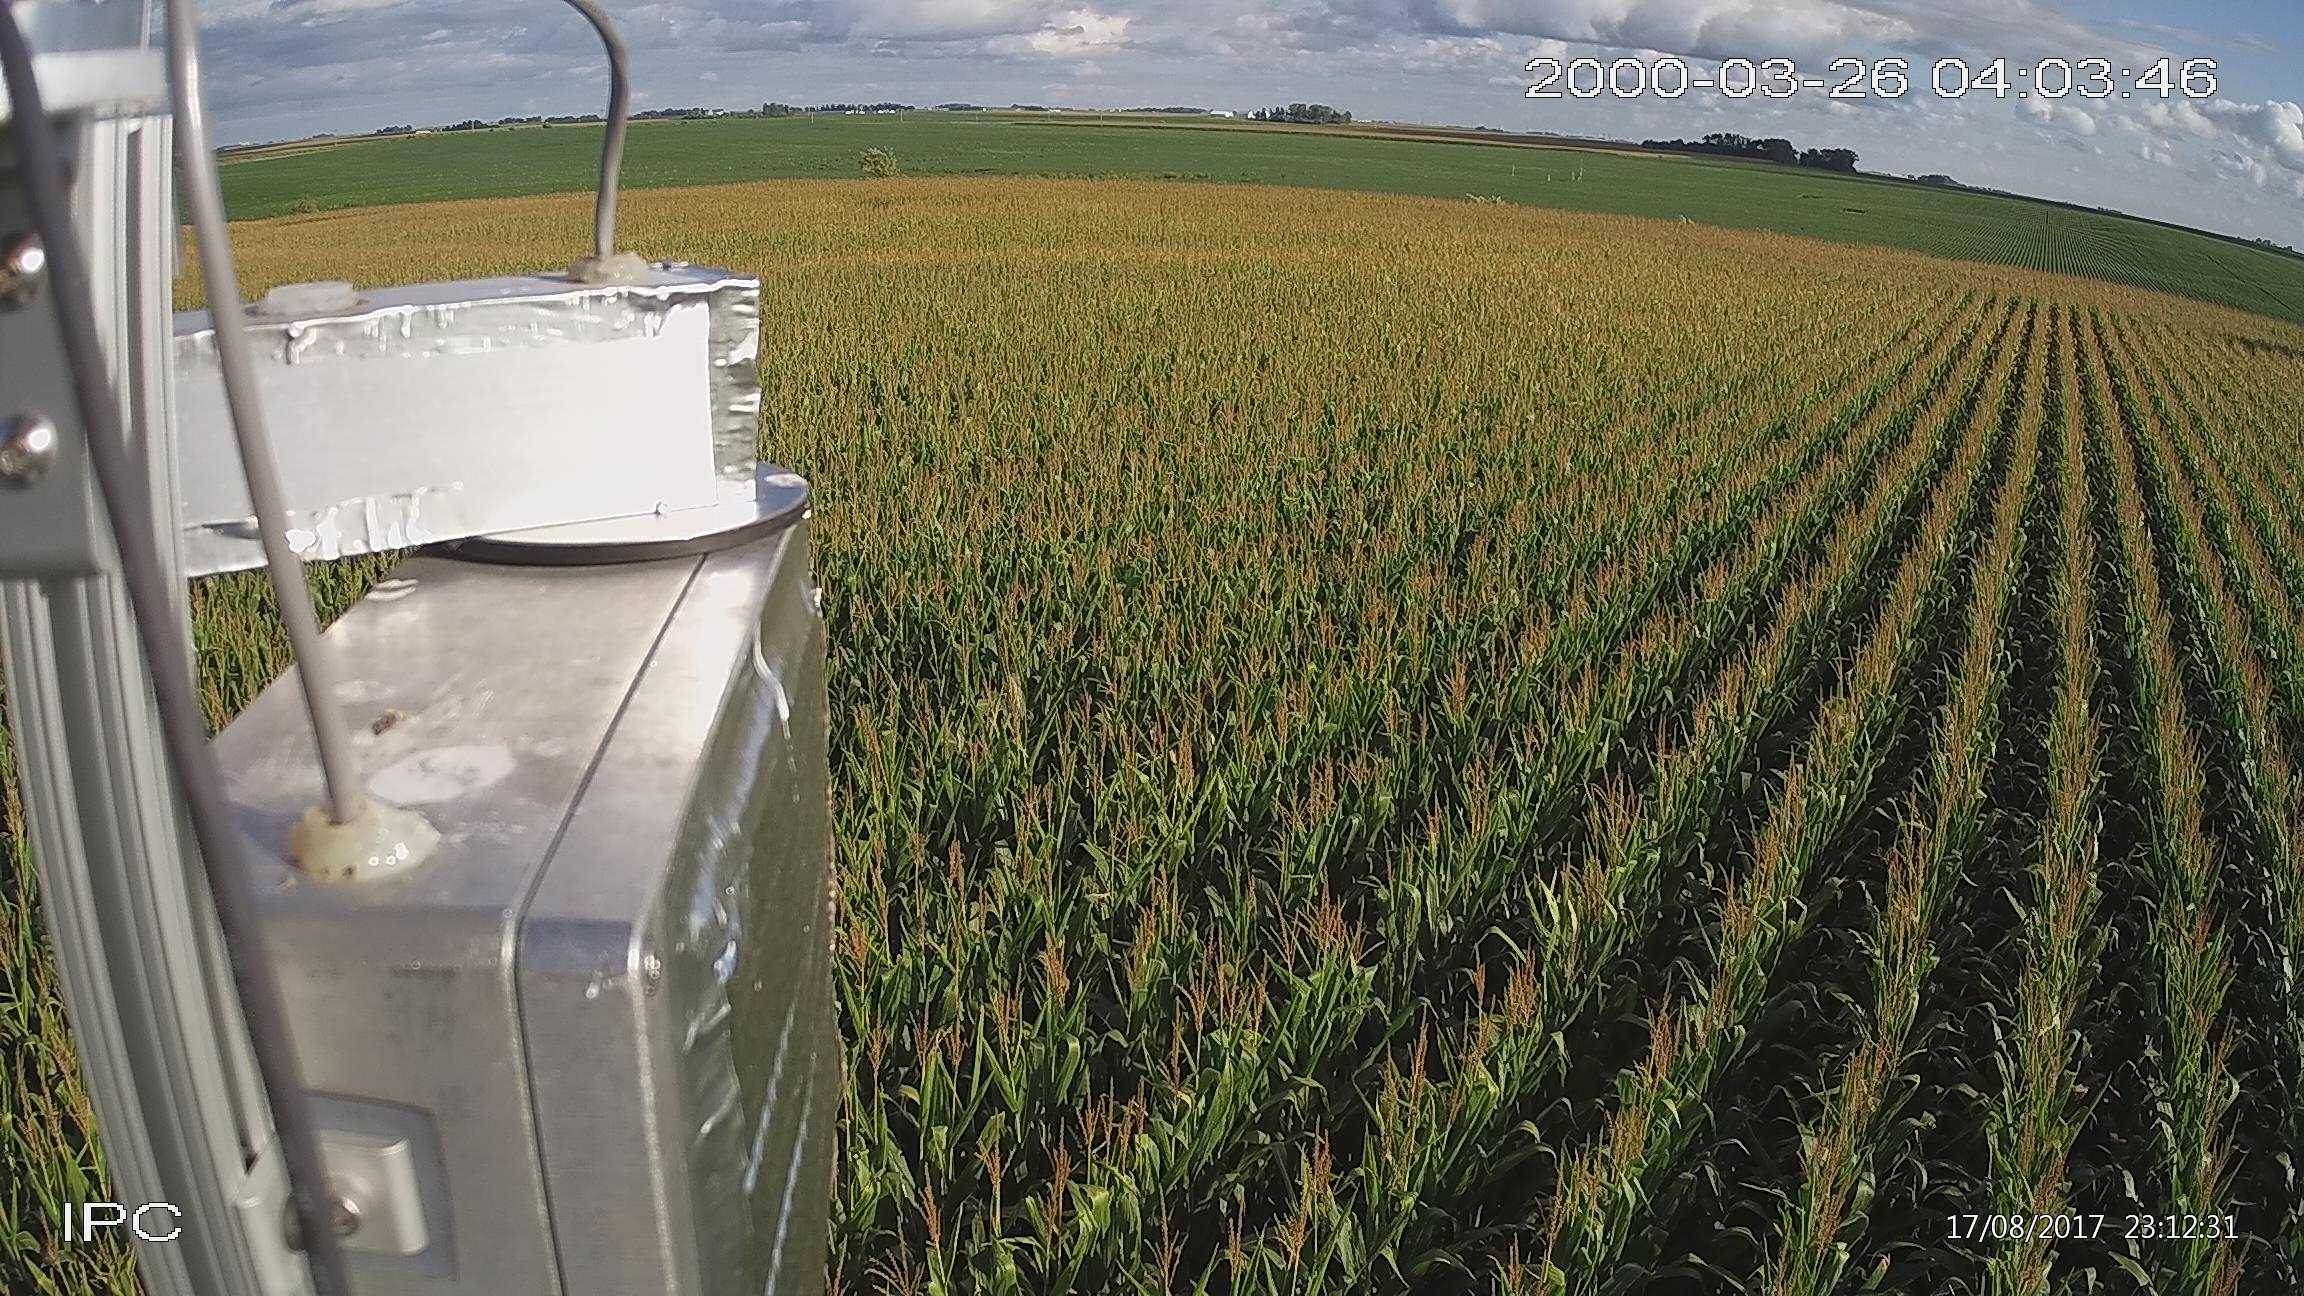
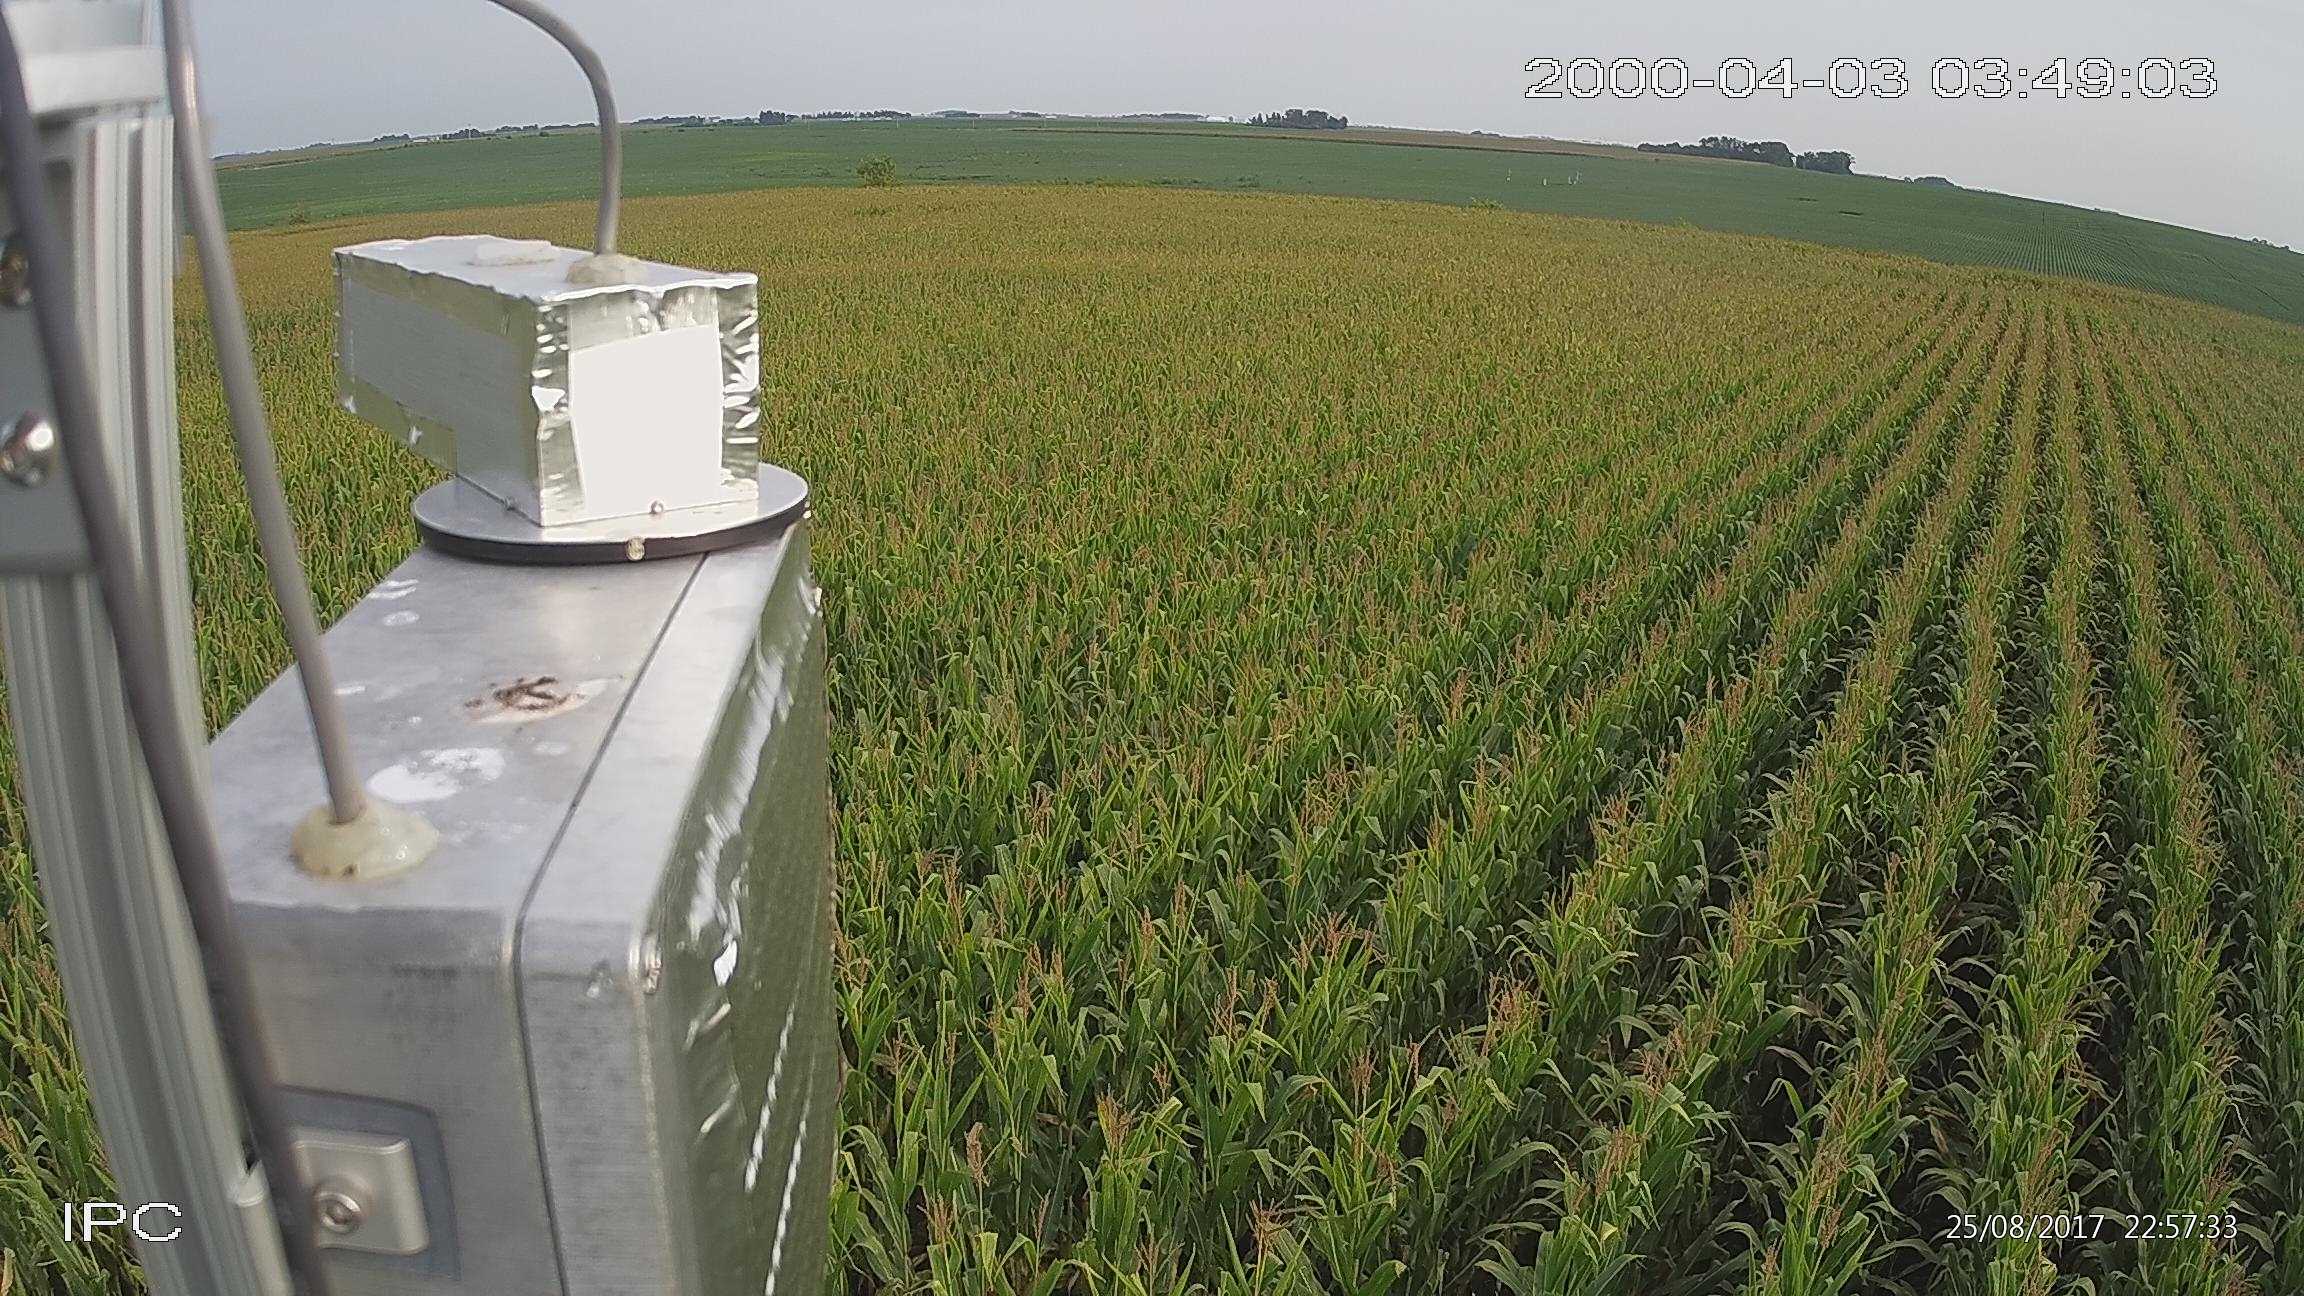
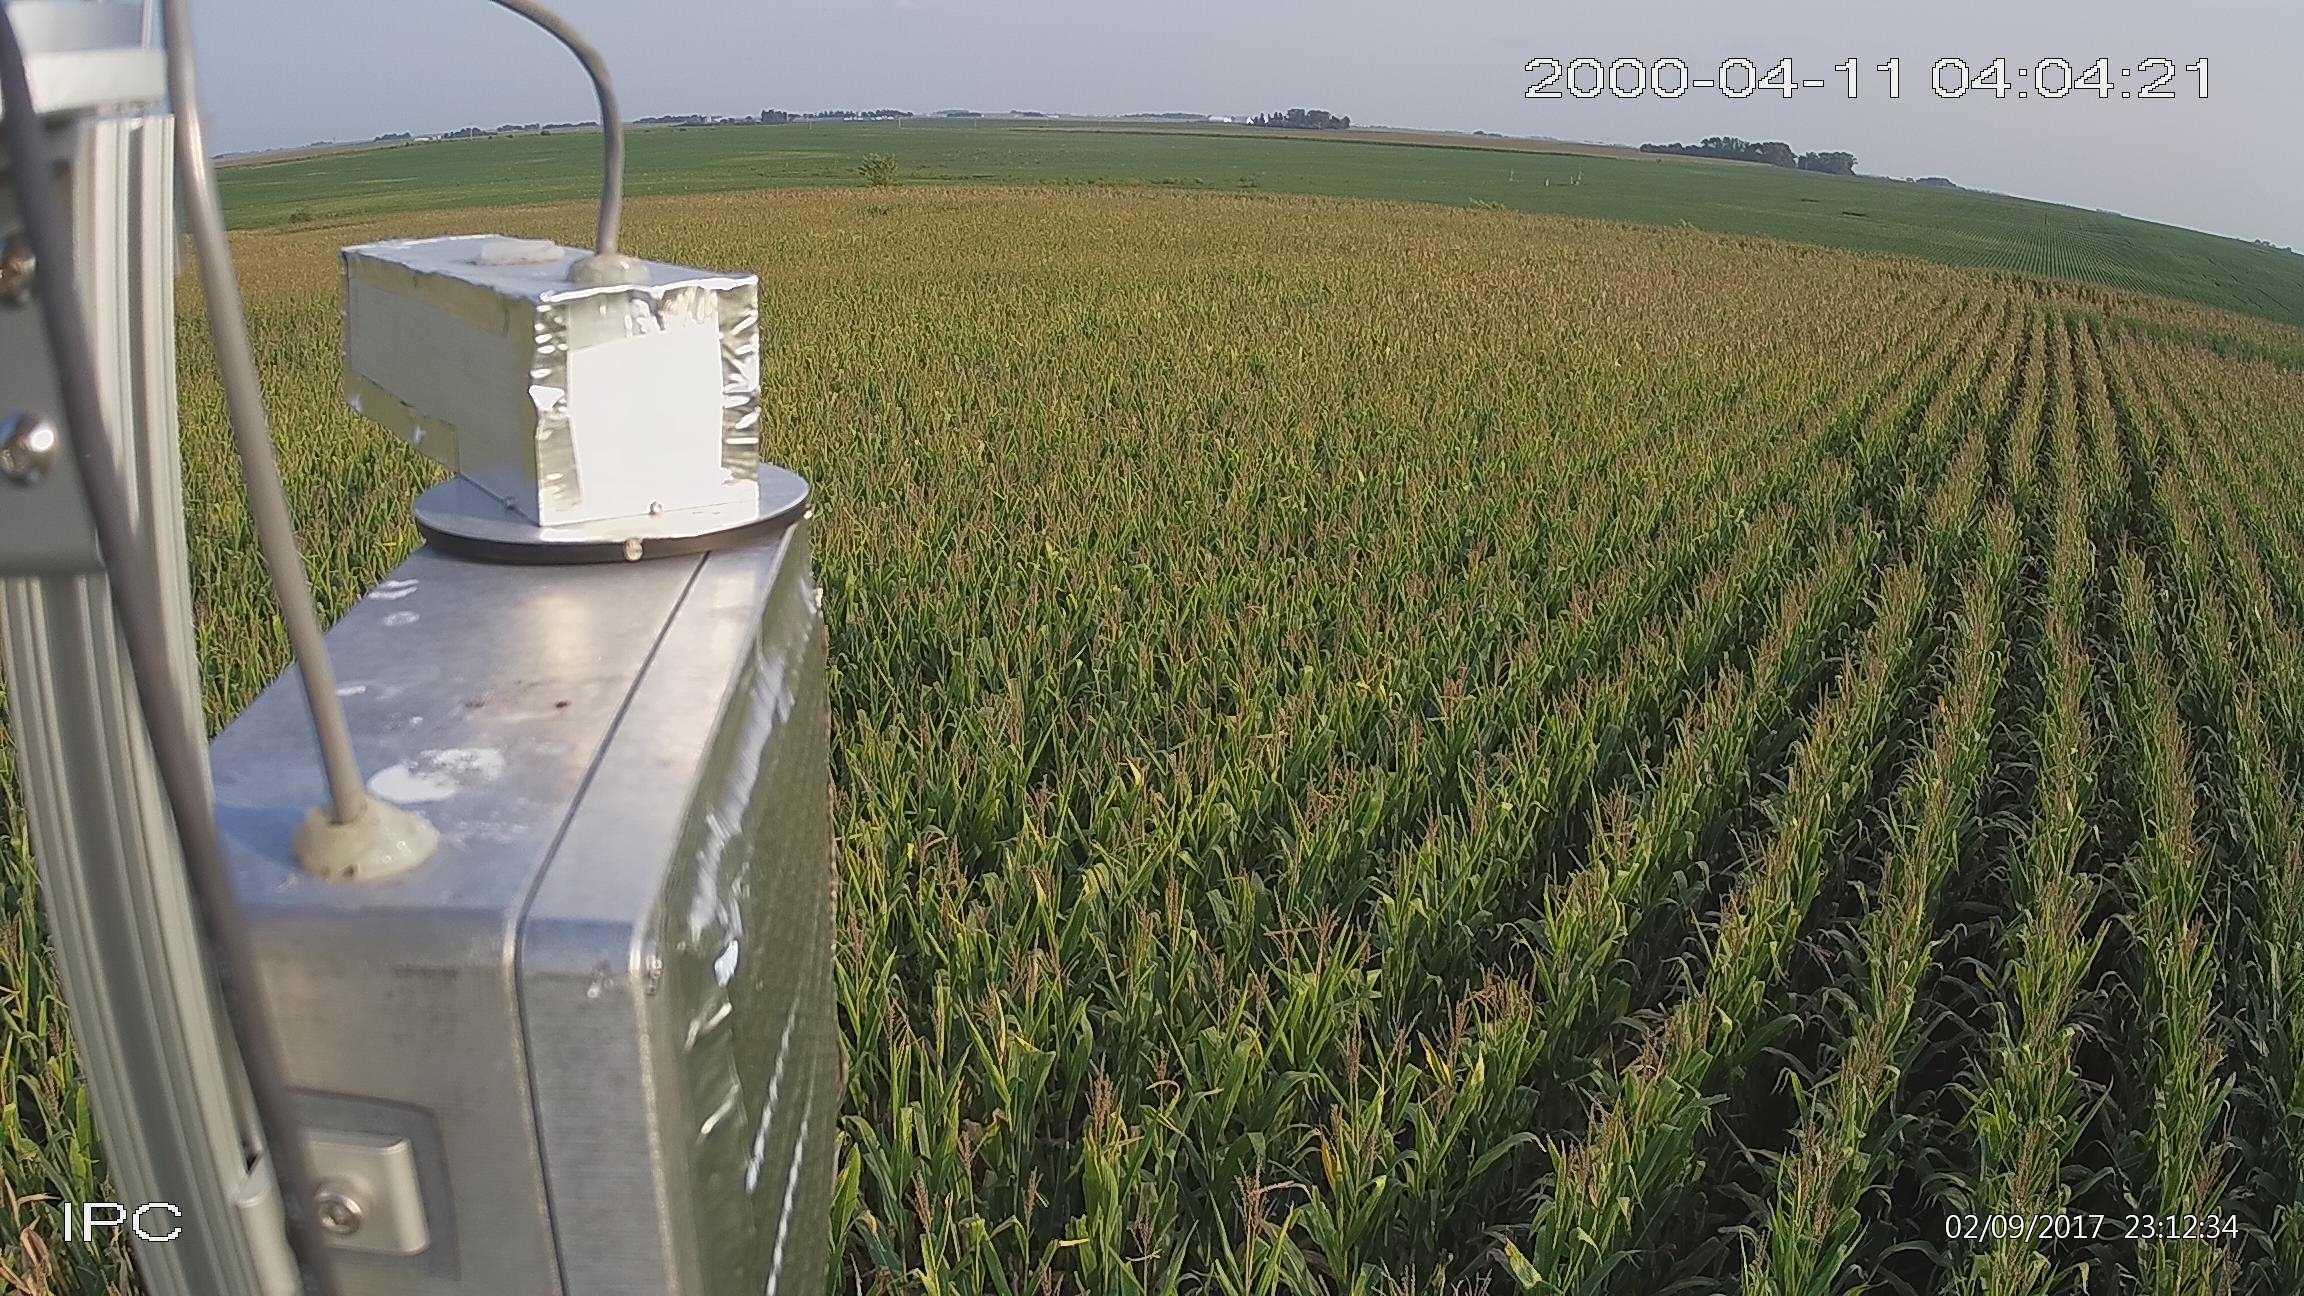
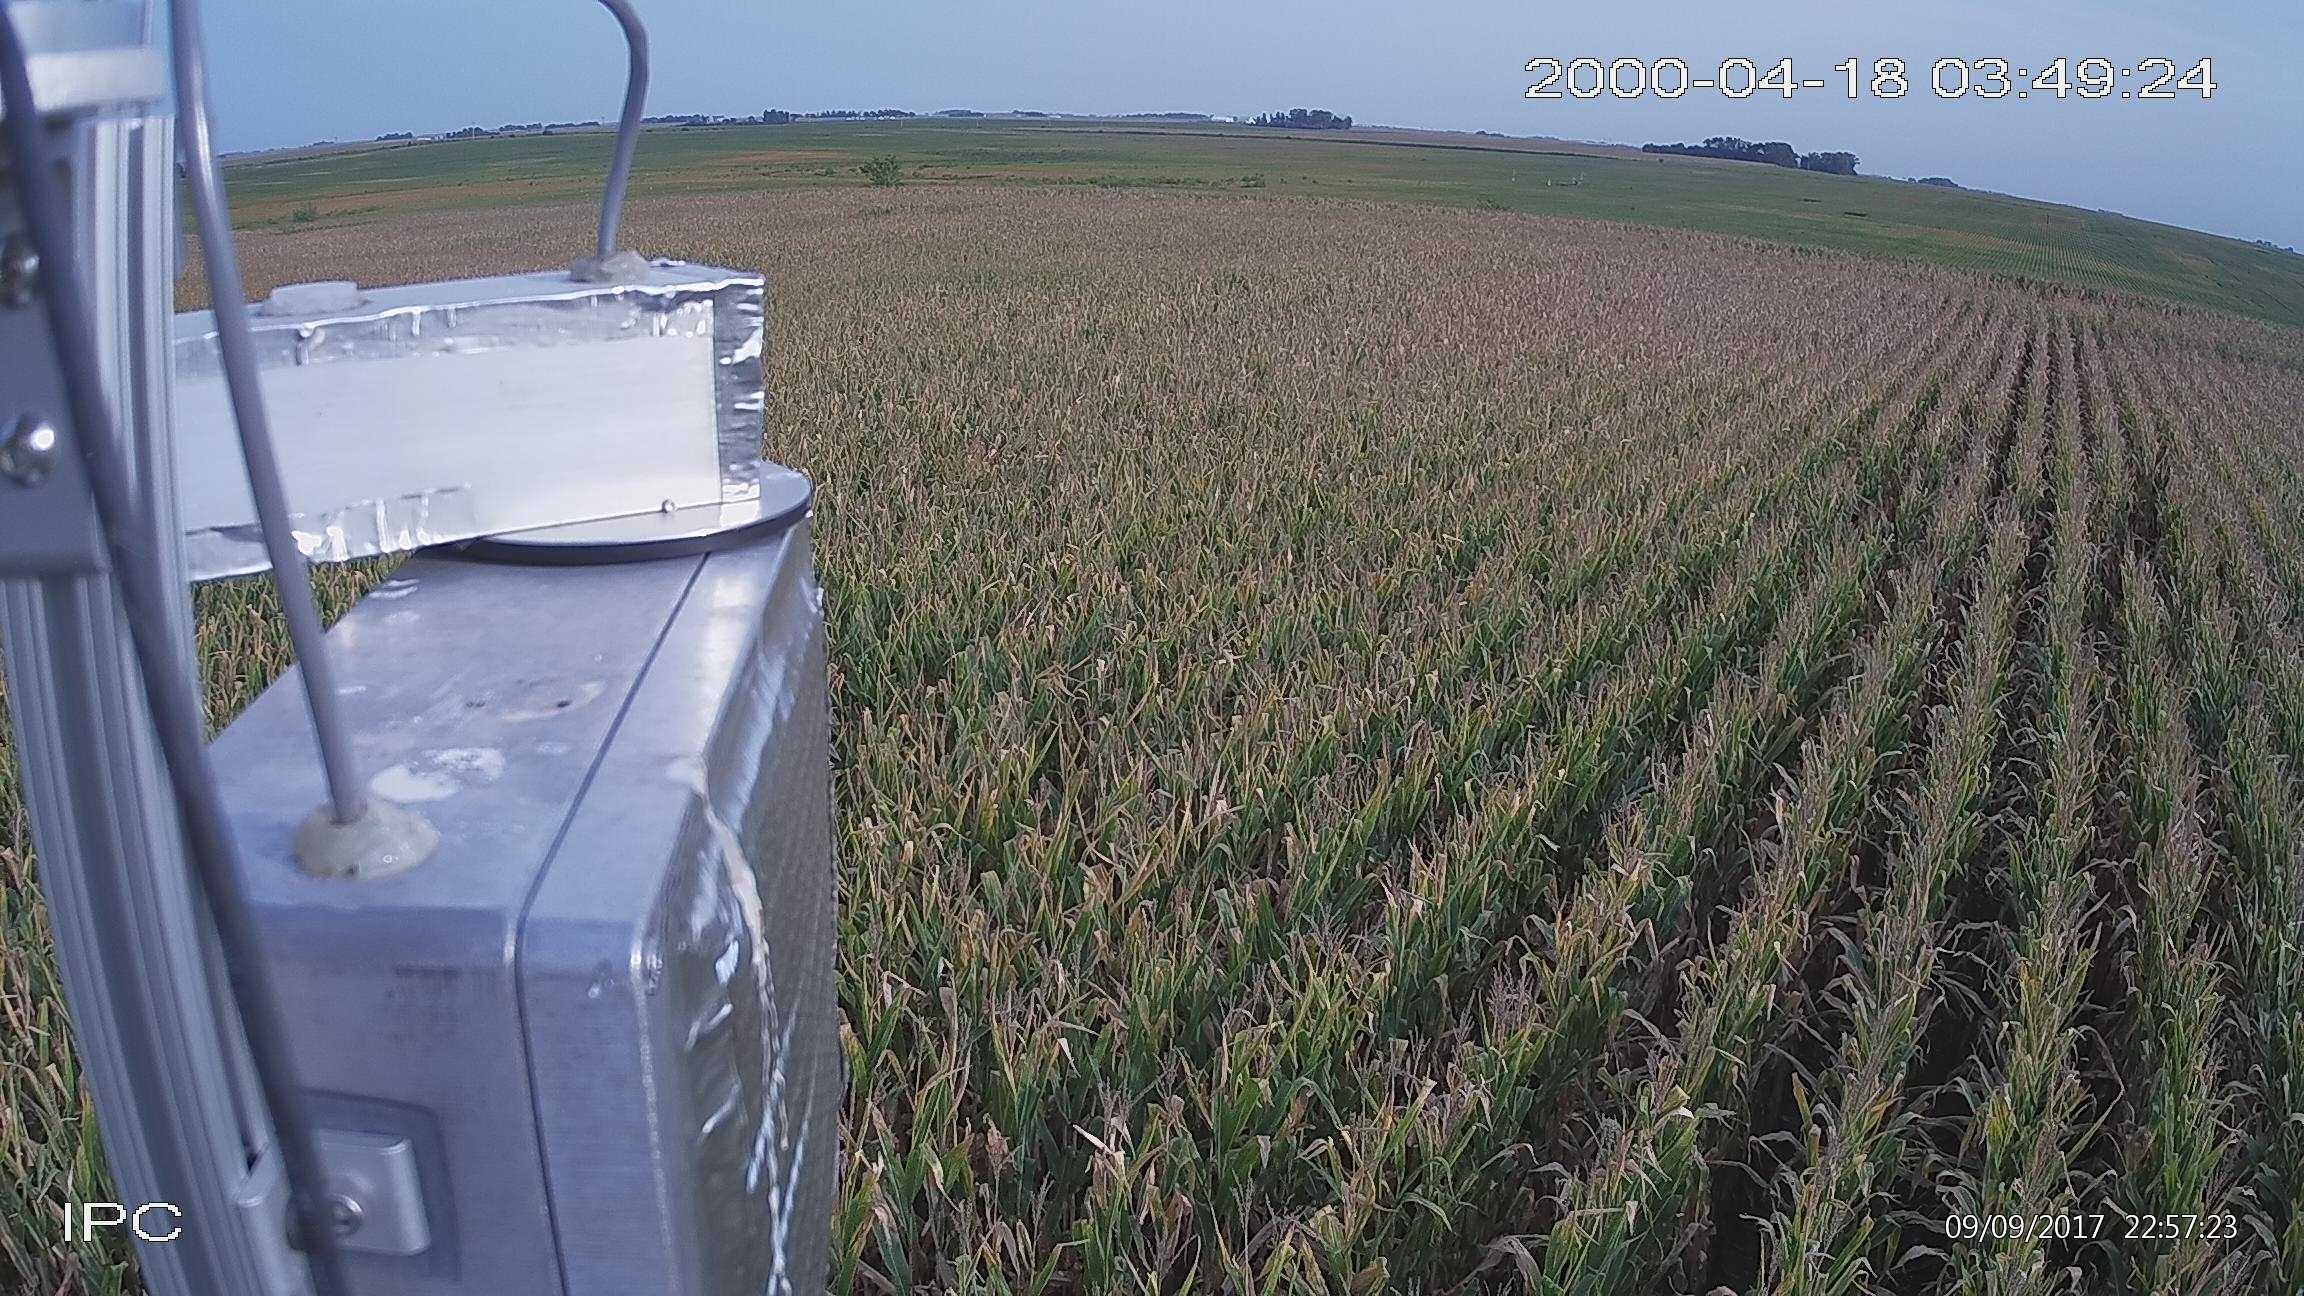
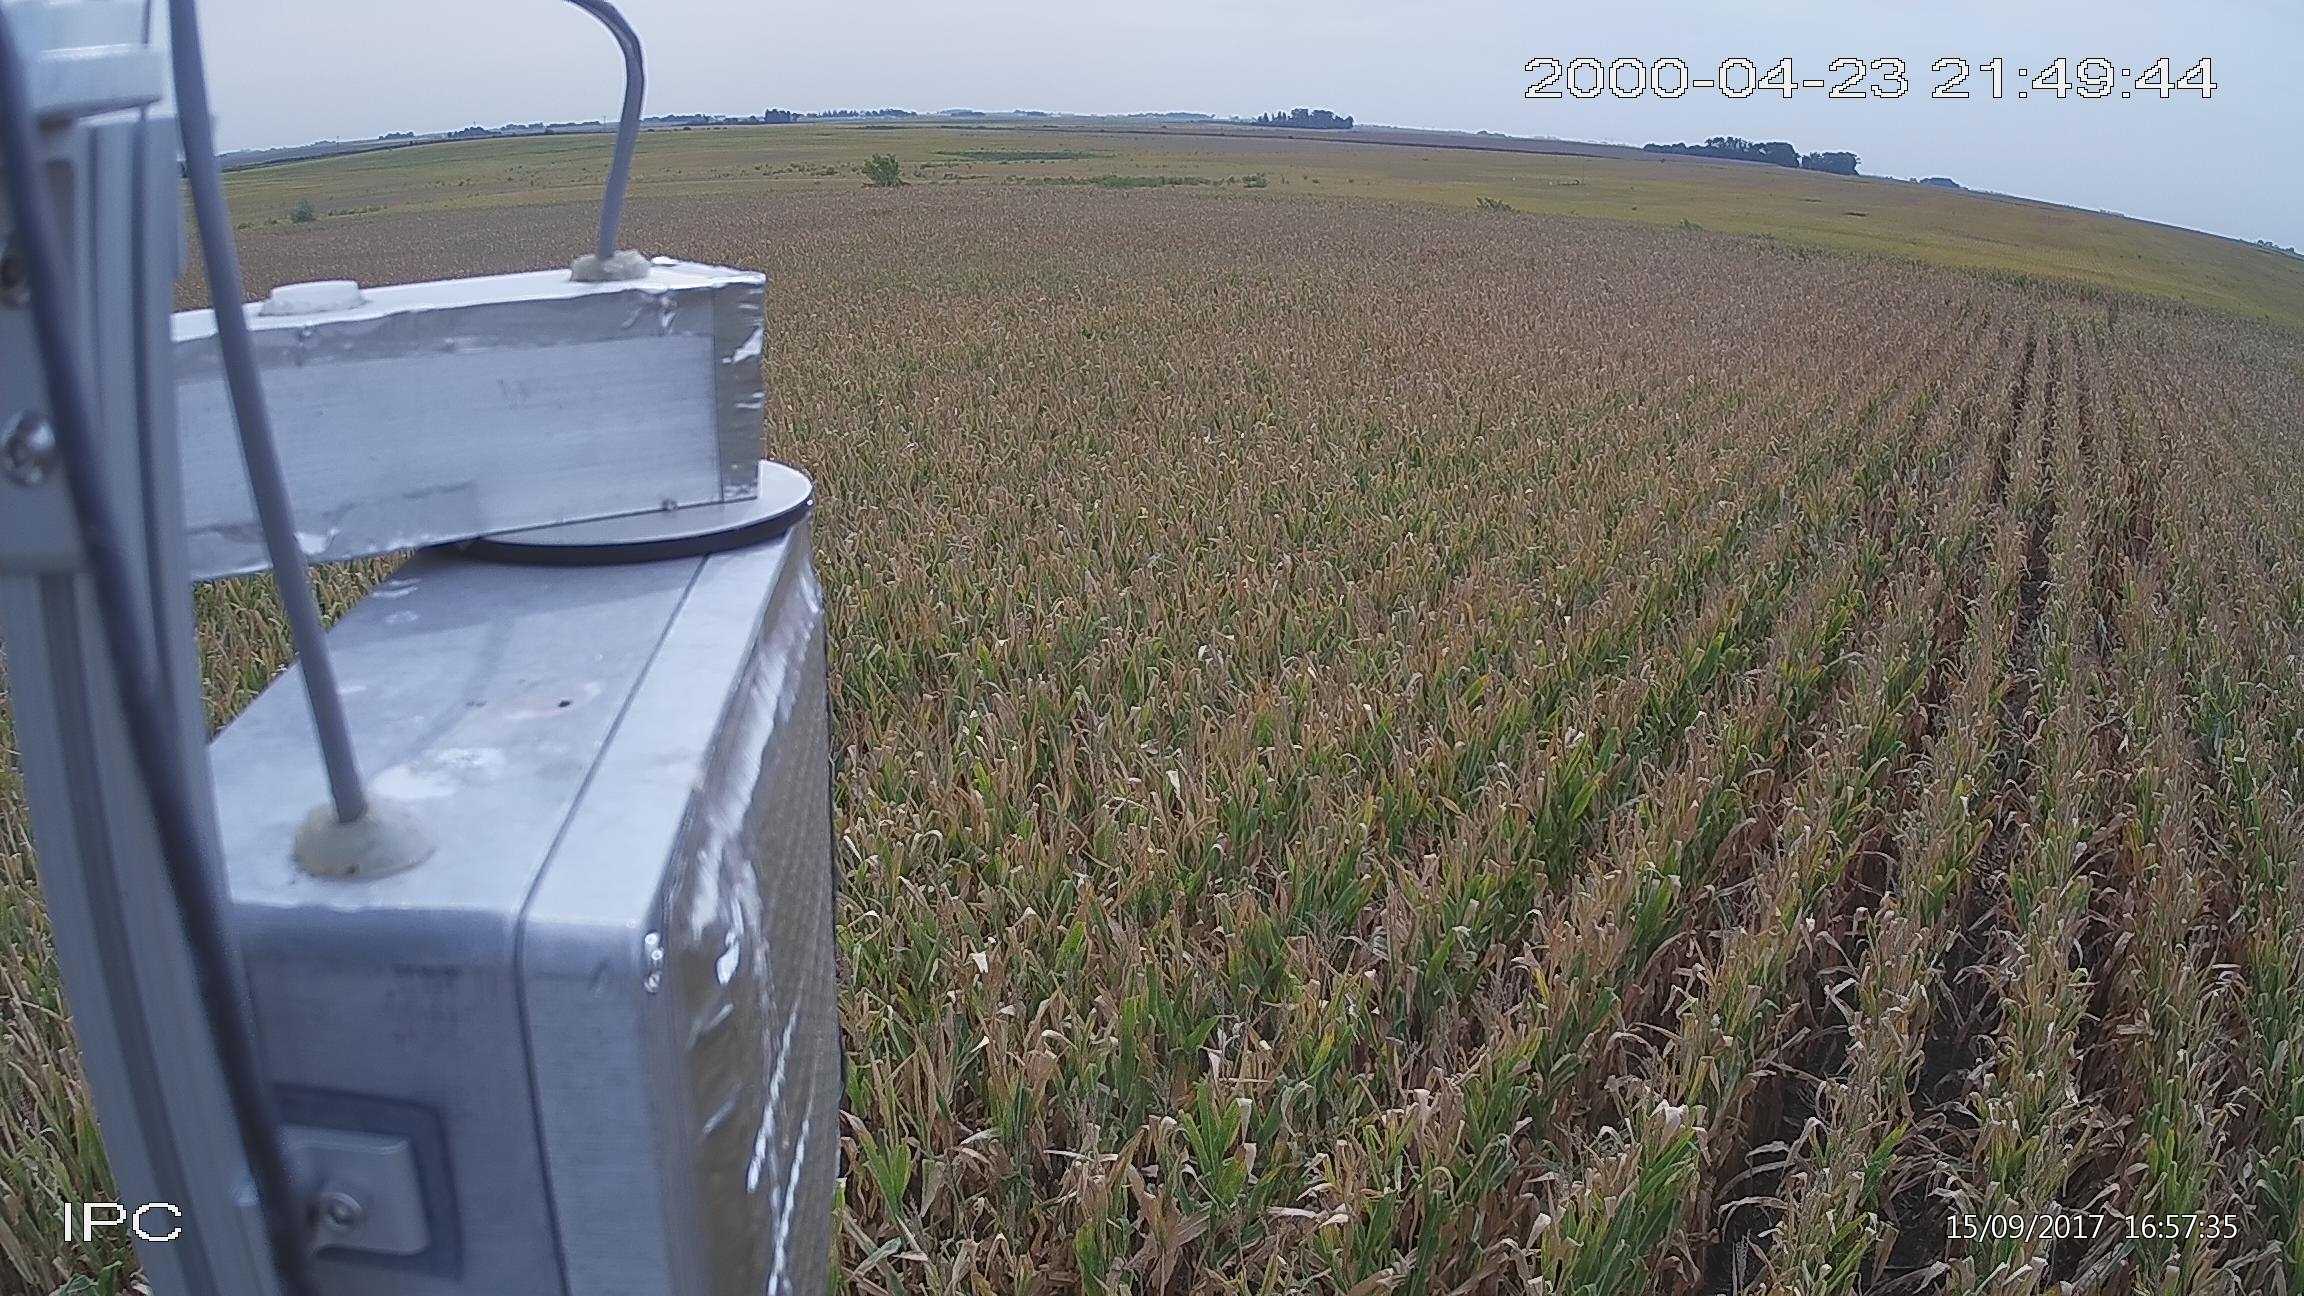
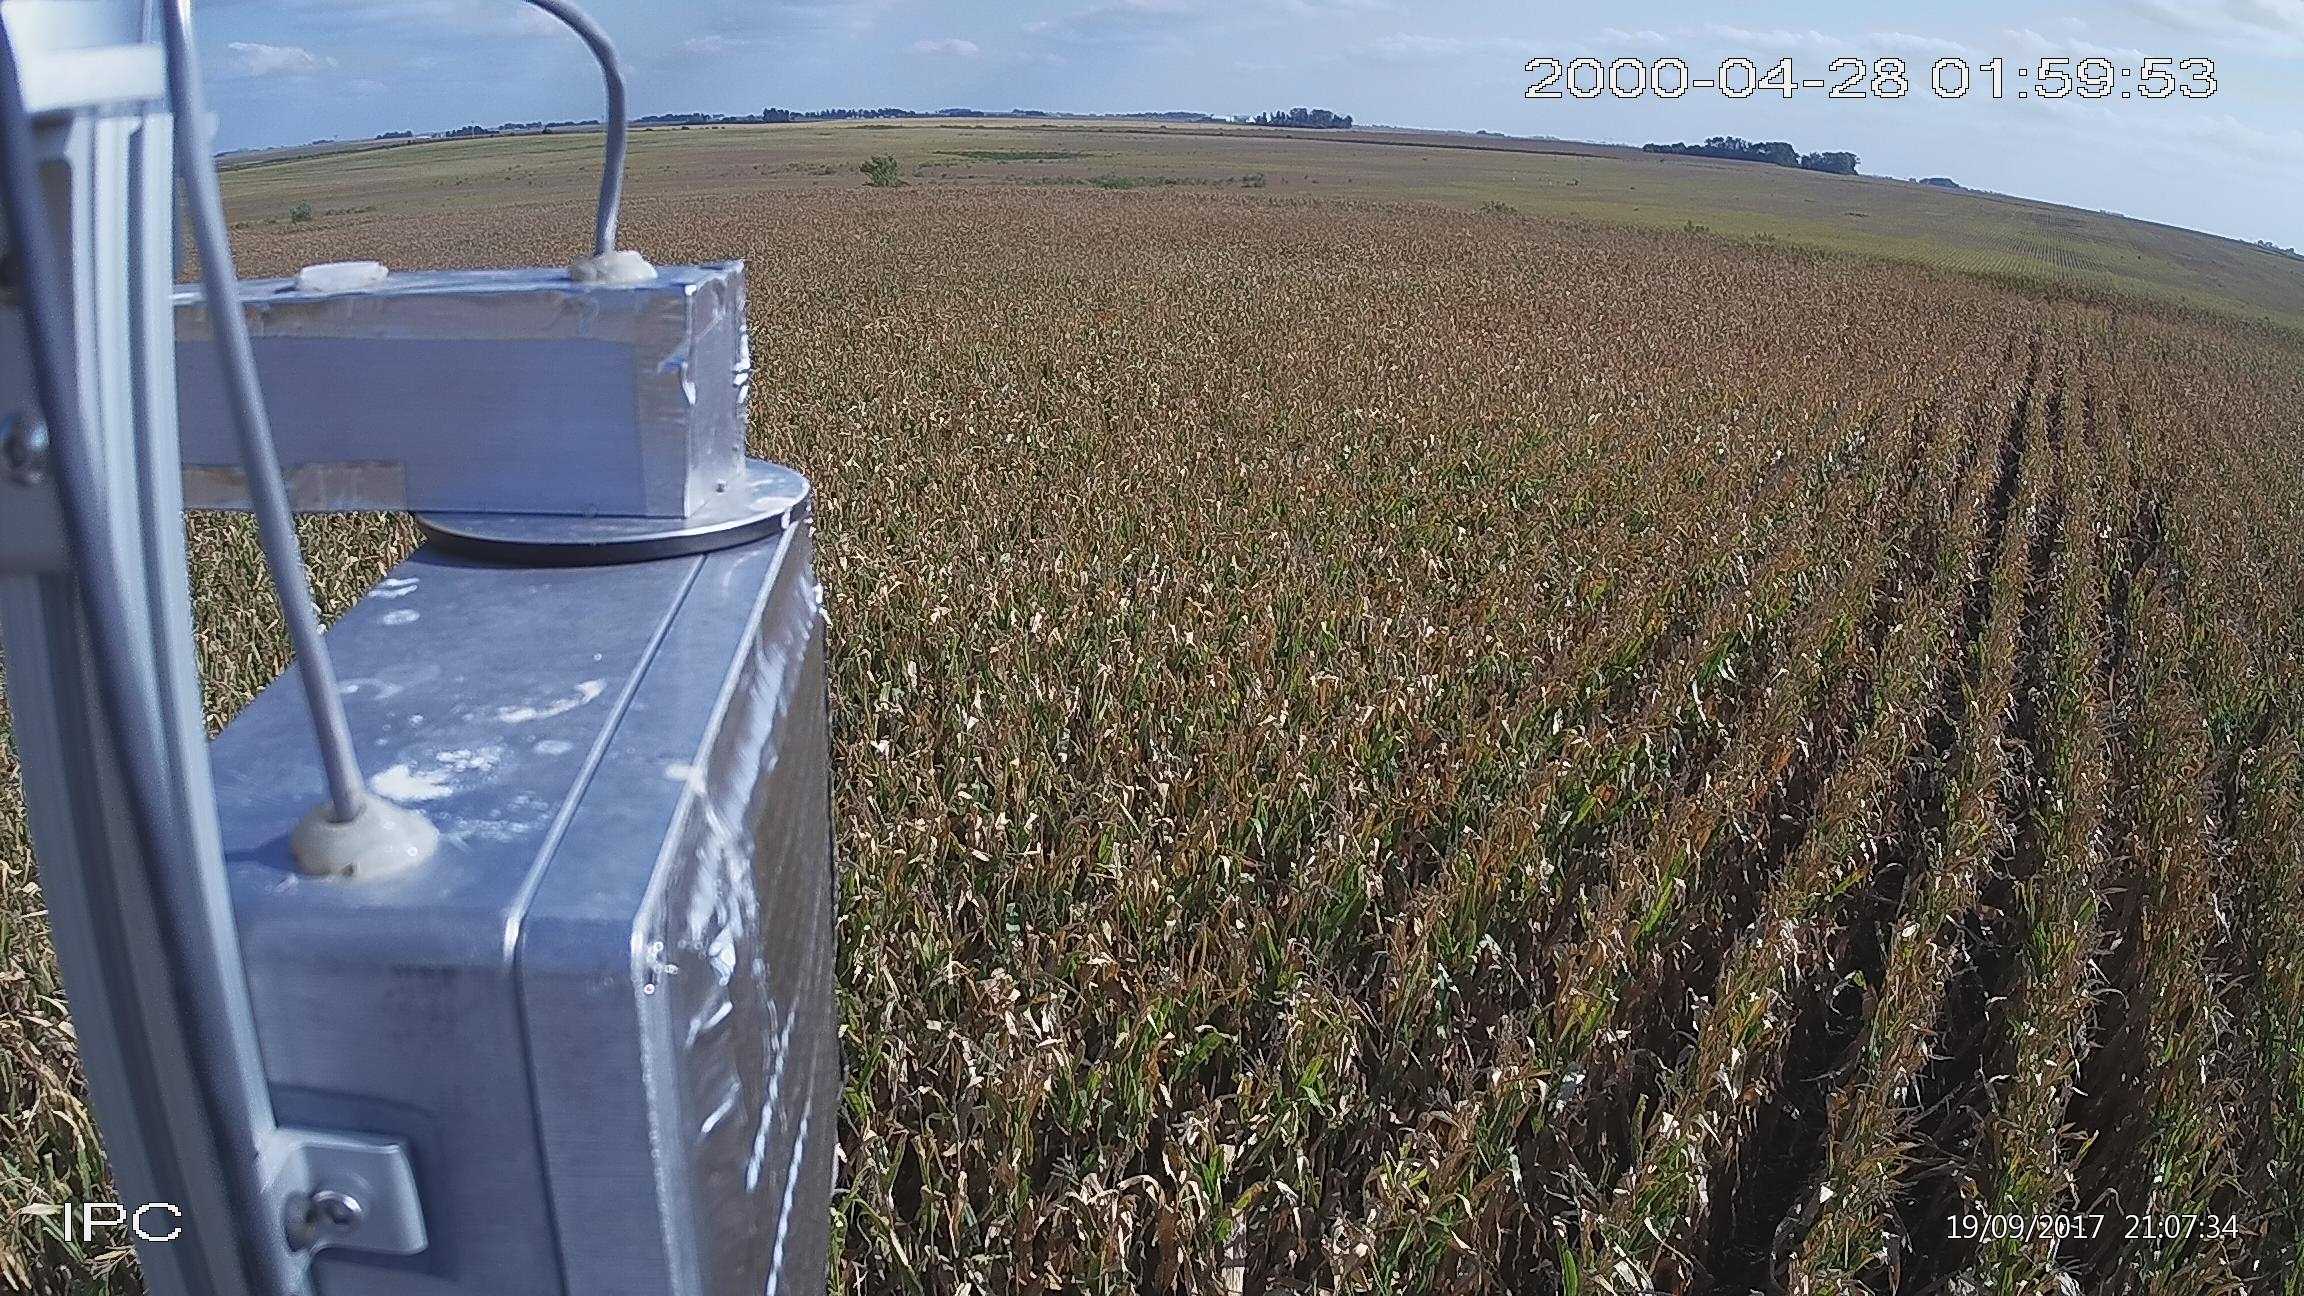
We installed two PhotoSpec instruments in a corn field (Coles Field, 42.48655°N, −93.52641°W) in central Iowa following planting in late May 2017 and measured SIF until harvest in September 2017 (Magney, Frankenberg, et al., 2019). PhotoSpec consists of a 2D scanning telescope to guide reflected radiances into a set of high‐resolution spectrometers (Grossmann et al., 2018) to infer SIF using the solar Fraunhofer line in‐filling technique, similar to all current satellite retrievals. The scanning telescope was placed atop a 7‐m tower, and we calculate a "canopy average" of all viewing angles at a half-hourly time step to match the temporal resolution of flux tower data (following Magney, Frankenberg, et al., 2019). Because the scanning telescope revisits every measuring point within a half-hour, this canopy average is more representative of a hemispherical sensor with a footprint of a few meters around the tower (an average of all viewing directions). Notably, while the escape ratio and angular dependencies are an important consideration for tower‐based SIF measurements (Zeng et al., 2019), this makes little difference in our study for the canopy structure is relatively stable during the peaking growing season. More details on PhotoSpec retrievals and instrument specifications can be found in Grossmann et al. (2018).
We also include pictures of the instrument at certain times during the growing season.
More details can be found in the following publications:
He, L., Magney, T., Dutta, D., Yin, Y., Köhler, P., Grossmann, K., … Frankenberg, C. (2020). From the ground to space: Using solar‐induced chlorophyll fluorescence (SIF) to estimate crop productivity. Geophysical Research Letters, 0–3. https://doi.org/10.1029/2020GL087474
Chang, C. Y., Guanter, L., Frankenberg, C., Köhler, P., Gu, L., Magney, T. S., … Sun, Y. (2020). Systematic assessment of retrieval methods for canopy far‐red solar‐induced chlorophyll fluorescence (SIF) using high‐frequency automated field spectroscopy. Journal of Geophysical Research: Biogeosciences. https://doi.org/10.1029/2019jg005533
Please contact Troy Magney at tmagney@ucdavis.edu if you would like access to higher resolution data.
Files
corn2017_30min_PhotoSpec_nofilter_UIUC.csv
Files
(80.2 MB)
| Name | Size | |
|---|---|---|
|
md5:cea395ed9411f4b1e20160cc532ab5ba
|
19.9 kB | Download |
|
md5:d7a474300a1ea2090b585a2b73c0232f
|
578.2 kB | Preview Download |
|
md5:13b30b9bee7b81d3a771d27d7d83c146
|
67.5 MB | Preview Download |
|
md5:78cdd7156b9a760c2c6810fbc5d13fc5
|
2.8 MB | Preview Download |
|
md5:8ac3134017cca0fdd3a86d8c8e1a26e2
|
770.2 kB | Preview Download |
|
md5:5b1da86ab3a134576edda6521c6cea96
|
643.5 kB | Preview Download |
|
md5:eec8fb234cc8c39ad036ad166c6be70a
|
605.6 kB | Preview Download |
|
md5:41e75dfcfaaecb278d174ae6cd658e4b
|
542.7 kB | Preview Download |
|
md5:8d88b349d1f72acbd9ec6925351ac93c
|
473.3 kB | Preview Download |
|
md5:2a39c3094f31e524b2657d315338d34b
|
306.6 kB | Preview Download |
|
md5:12371889984834da81a5c4685369cfad
|
351.7 kB | Preview Download |
|
md5:f7766416b7ac7adac71074dd04f5b862
|
473.7 kB | Preview Download |
|
md5:c474726c56002277d043ad4a522abd6e
|
527.9 kB | Preview Download |
|
md5:d8cbd60a6c3ab6369c97d2d77745d12c
|
386.7 kB | Preview Download |
|
md5:069fb1de995ed2039d466c78482b33a2
|
472.5 kB | Preview Download |
|
md5:2bf773e3f3467a9916825735f451335e
|
550.1 kB | Preview Download |
|
md5:eea12f2720f66c0777e8838a0e774c53
|
552.7 kB | Preview Download |
|
md5:a4d694c6c02316b066986bd93ce5ae8b
|
506.6 kB | Preview Download |
|
md5:2c503506ecdc9f6b5c27a2fa0361c0a0
|
534.1 kB | Preview Download |
|
md5:67026eaa38a5c28617025adb21092f11
|
516.7 kB | Preview Download |
|
md5:e347d9d00ed677ac4bcf4e53974eb745
|
493.6 kB | Preview Download |
|
md5:b2d52a675a6c3c7f986a0501ec15498a
|
626.8 kB | Preview Download |
Additional details
Identifiers
- CALTECHDATA_ID
- 1650
Funding
- NASA
- :unav Part of this research was funded by the NASA Carbon Cycle Science program (grant NNX17AE14G). L.H.